Sasmirala Individual Information for MCG-2-8-39
Description
MCG-2-8-39 is a possible merger system with spiral-like morphology and two nuclei (separation: ~ 13arcsec ~ 7.3 kpc; PA~ 10∘; [heisler_double-nucleus_1989]) at a redshift of z = 0.0299 (D ~123 Mpc). The brighter northern nucleus A is identified with a Sy 2 nucleus with polarized broad emission lines [tran_hidden_2001], while nucleus B has the optical spectrum of a H II region [heisler_double-nucleus_1989]. After its detection with IRAS, MCG-2-8-39 was observed with the MMT bolometer in N-band [maiolino_new_1995] and with Spitzer/IRAC and IRS. In the IRAC images, compact MIR nuclei are detected in positions A and B with weak extended host emission. Nucleus B is significantly weaker than nucleus A, for which our IRAC 5.8 and 8.0 μm is consistent with [gallimore_infrared_2010]. The IRS LR mapping-mode spectrum of nucleus A is relatively featureless apart from a possible silicate 18 μm emission feature which coincides with the peak of the MIR SED (see also [buchanan_spitzer_2006, wu_spitzer/irs_2009, tommasin_spitzer-irs_2010, gallimore_infrared_2010]). MCG-2-8-39 was observed with T-ReCS in the Qa filter during two nights in 2007. In the images, only nucleus A was detected as a point source with no signs of any extended host emission. Our nuclear photometry is interestingly ~ 23% higher than the Spitzer spectrophotometry, while the latter is also lower than the MMT photometry by [maiolino_new_1995]. This points at a problem in the flux calibration of the Spitzer PBCD data rather than any variability. Therefore, we extrapolate from the Qa measurement towards shorter wavelengths in order to compute the nuclear 12 μm continuum emission estimate as described in Sect. 4.3.
- [buchanan_spitzer_2006] Catherine L. Buchanan, Jack F. Gallimore, Christopher P. O'Dea, Stefi A. Baum, David J. Axon, Andrew Robinson, Moshe Elitzur, and Martin Elvis. Spitzer IRS spectra of a large sample of seyfert galaxies: A variety of infrared spectral energy distributions in the local active galactic nucleus population . AJ , 132 pp. 401–419, July 2006.
- [gallimore_infrared_2010] J. F. Gallimore, A. Yzaguirre, J. Jakoboski, M. J. Stevenosky, D. J. Axon, S. A. Baum, C. L. Buchanan, M. Elitzur, M. Elvis, C. P. O'Dea, and A. Robinson. Infrared spectral energy distributions of seyfert galaxies: Spitzer space telescope observations of the 12 μm sample of active galaxies . ApJS , 187 pp. 172–211, March 2010.
- [heisler_double-nucleus_1989] Charlene A. Heisler, J. Patricia Vader, and Jay A. Frogel. The double-nucleus galaxy IRAS 02580-1136 - a merging system . AJ , 97 pp. 986–994, April 1989.
- [maiolino_new_1995] R. Maiolino, M. Ruiz, G. H. Rieke, and L. D. Keller. New constraints on the unified model of seyfert galaxies . ApJ , 446 pp. 561, June 1995.
- [tommasin_spitzer-irs_2010] Silvia Tommasin, Luigi Spinoglio, Matthew A. Malkan, and Giovanni Fazio. Spitzer-IRS high-resolution spectroscopy of the 12 μm seyfert galaxies. II. results for the complete data set . ApJ , 709 pp. 1257–1283, February 2010.
- [tran_hidden_2001] Hien D. Tran. Hidden broad-line seyfert 2 galaxies in the CFA and 12 μM samples . ApJL , 554 pp. L19–L23, June 2001.
- [wu_spitzer/irs_2009] Yanling Wu, Vassilis Charmandaris, Jiasheng Huang, Luigi Spinoglio, and Silvia Tommasin. Spitzer/IRS 5-35 μm low-resolution spectroscopy of the 12 μm seyfert sample . ApJ , 701 pp. 658–676, August 2009.
Images
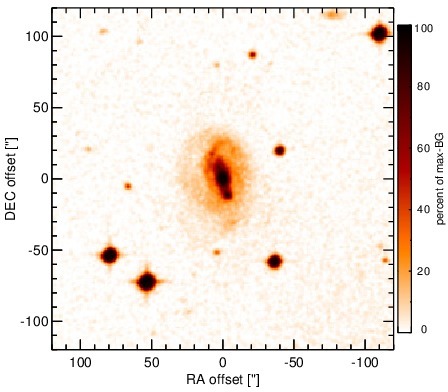
Optical image (DSS, red filter). Displayed are the central 4 arcmin with North being up and East to the left. The colour scaling is linear with white corresponding to the median background (BG) and black to the 0.01% pixels with the highest intensity.
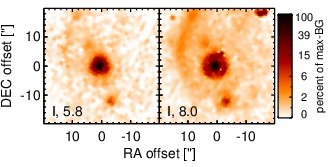
Spitzer MIR images. Displayed are the inner 40 arcsec with North being up and East to the left. The colour scaling is logarithmic with white corresponding to median BG and black to the 0.1% pixels with the highest intensity. The label in the bottom left states instrument and central wavelength of the filter in micron (I: IRAC, M: MIPS).
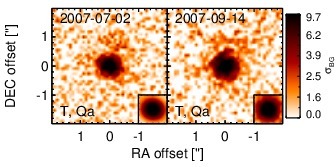
Subarcsecond-resolution MIR images sorted by increasing filter central wavelength. Displayed are the inner 4 arcsec with North being up and East to the left. The colour scaling is logarithmic with white corresponding to median BG and black to the 75% of the highest intensity of all images in units of sig_bg. The inset image (where present; either bottom or top right) shows the central arcsecond of the PSF from the calibrator star, scaled to match the science target. The labels in the bottom left state instrument and filter names (C: COMICS, M: Michelle, T: T-ReCS, V: VISIR).
SEDs
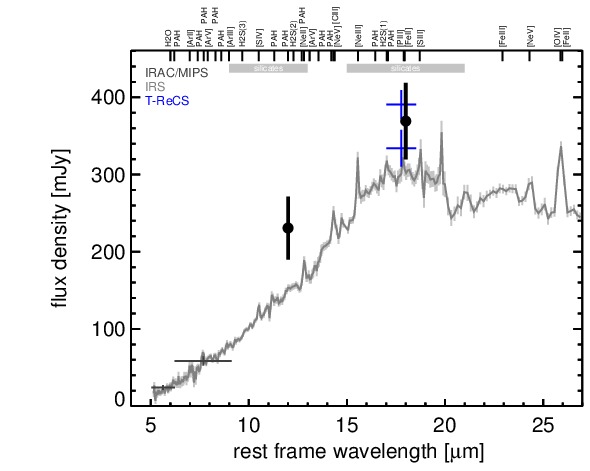
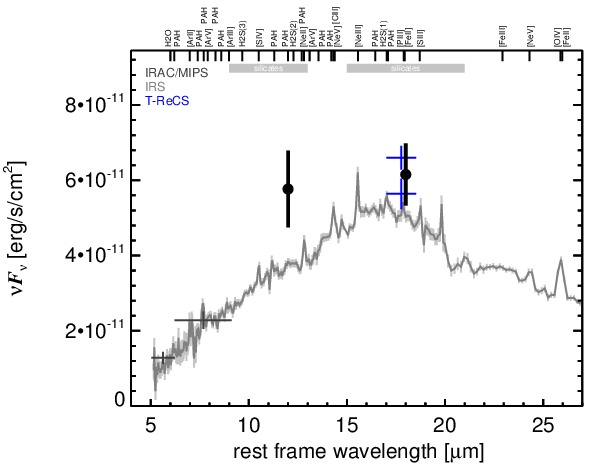
MIR SED. The description of the symbols in all the SED plots (where present) is the following: Grey crosses and solid lines mark the Spitzer/IRAC, MIPS and IRS data. The colour coding of the other symbols is as follows: green for COMICS, magenta for Michelle, blue for T-ReCS and red for VISIR data. Darker-coloured solid lines mark spectra of the corresponding instrument. The black filled circles mark the nuclear 12 and 18 micron continuum emission estimate from the data (where present). The ticks on the top axis mark positions of common MIR emission lines, while the light grey horizontal bars mark wavelength ranges affected by the silicate 10 and 18 micron features.