Sasmirala Individual Information for MCG-3-34-64
Description
MCG-3-34-64 is an early-type infrared-luminous spiral galaxy at a redshift of z = 0.0165 (D ~ Mpc) with a Sy 1.8-2 nucleus [aguero_spectral_1994, de_grijp_warm_1992] with polarized broad emission lines [young_polarimetry_1996]. It is a member of the nine-month BAT AGN sample and possesses a jet visible in radio with an inner PA of ~ 39∘ [schmitt_jet_2001]. Not that MCG-3-34-64 is often confused with or erroneously called MCG-3-34-63. After its detection through IRAS [osterbrock_optical_1985, de_robertis_optical_1988], MCG-3-34-64 was observed in the N-band with IRTF [hill_infrared_1988] and with Palomar 5 m/MIRLIN [gorjian_10_2004]. In the Spitzer/IRAC and MIPS images, the nucleus appears marginally resolved but without significantly extended host emission. Our nuclear IRAC 5.8 μm and MIPS 24 μm photometry is consistent with [u_spectral_2012], while the PBCD IRAC 8.0 μm image is saturated and not analysed. The IRS LR staring-mode spectrum exhibits silicate 10 μm absorption, weak PAH emission, and a red spectral slope with a peak at ~ 17 μm (see also [tommasin_spitzer-irs_2010, mullaney_defining_2011]). We observed MCG-3-34-64 with VISIR in three narrow N-band filters in 2006 [horst_mid_2008, horst_mid-infrared_2009], followed by a VISIR LR N-band spectrum in 2008 [honig_dusty_2010-1]. In addition, a VISIR NEII_2 image from 2006 is available (unpublished, to our knowledge). As already discussed in [honig_dusty_2010-1], the MIR nucleus detected in all images appears elongated (FWHM(major axis)~ 0.52arcsec ~ 180 pc; PA~ 51∘), which roughly coincides with the radio jet. The VISIR spectrophotometry of the total nuclear flux presented in [honig_dusty_2010-1] agrees with the Spitzer spectrophotometry, while our measurement of the unresolved nuclear fluxes alone is on average ~ 34% lower. The silicate absorption feature seems to be reproduced by the latter, which indicates an origin in the projected central ~ 120 pc. Note that the NEII_2 flux is much closer to the total nuclear flux because it was measured during bad MIR seeing conditions and contains the [Ne II] emission line.
- [aguero_spectral_1994] E. L. Aguero, J. H. Calderon, S. Paolantonio, and E. Suarez Boedo. Spectral emission of a sample of IRAS galaxies . PASP , 106 pp. 978–982, September 1994.
- [de_grijp_warm_1992] M. H. K. de Grijp, W. C. Keel, G. K. Miley, P. Goudfrooij, and J. Lub. Warm IRAS sources. II - optical spectroscopy of objects from the point source catalog . A&AS , 96 pp. 389–428, December 1992.
- [de_robertis_optical_1988] M. M. De Robertis, J. B. Hutchings, and Ronald E. Pitts. An optical and UV investigation of the IRAS seyfert galaxy 1319-164 . AJ , 95 pp. 1371–1377, May 1988.
- [gorjian_10_2004] V. Gorjian, M. W. Werner, T. H. Jarrett, D. M. Cole, and M. E. Ressler. 10 micron imaging of seyfert galaxies from the 12 micron sample . ApJ , 605 pp. 156–167, April 2004.
- [hill_infrared_1988] G. J. Hill, E. E. Becklin, and C. G. Wynn-Williams. Infrared sizes and colors of selected IRAS galaxies . ApJ , 330 pp. 737–742, July 1988.
- [honig_dusty_2010-1] S. F. Hönig, M. Kishimoto, P. Gandhi, A. Smette, D. Asmus, W. Duschl, M. Polletta, and G. Weigelt. The dusty heart of nearby active galaxies. i. high-spatial resolution mid-IR spectro-photometry of seyfert galaxies . A&A , 515 pp. 23, June 2010.
- [horst_mid-infrared_2009] H. Horst, W. J. Duschl, P. Gandhi, and A. Smette. Mid-infrared imaging of 25 local AGN with VLT-VISIR . A&A , 495 pp. 137–146, February 2009.
- [horst_mid_2008] H. Horst, P. Gandhi, A. Smette, and W. J. Duschl. The mid IR - hard x-ray correlation in AGN and its implications for dusty torus models . A&A , 479 pp. 389–396, February 2008.
- [mullaney_defining_2011] J. R. Mullaney, D. M. Alexander, A. D. Goulding, and R. C. Hickox. Defining the intrinsic AGN infrared spectral energy distribution and measuring its contribution to the infrared output of composite galaxies . MNRAS , page 474, April 2011.
- [osterbrock_optical_1985] D. E. Osterbrock and M. M. De Robertis. Optical spectra of IRAS 'warm' galaxies . PASP , 97 pp. 1129–1141, December 1985.
- [schmitt_jet_2001] H. R. Schmitt, J. S. Ulvestad, R. R. J. Antonucci, and A. L. Kinney. Jet directions in seyfert galaxies: Radio continuum imaging data . ApJS , 132 pp. 199–209, February 2001.
- [tommasin_spitzer-irs_2010] Silvia Tommasin, Luigi Spinoglio, Matthew A. Malkan, and Giovanni Fazio. Spitzer-IRS high-resolution spectroscopy of the 12 μm seyfert galaxies. II. results for the complete data set . ApJ , 709 pp. 1257–1283, February 2010.
- [u_spectral_2012] Vivian U, D. B. Sanders, J. M. Mazzarella, A. S. Evans, J. H. Howell, J. A. Surace, L. Armus, K. Iwasawa, D.-C. Kim, C. M. Casey, T. Vavilkin, M. Dufault, K. L. Larson, J. E. Barnes, B. H. P. Chan, D. T. Frayer, S. Haan, H. Inami, C. M. Ishida, J. S. Kartaltepe, J. L. Melbourne, and A. O. Petric. Spectral energy distributions of local luminous and ultraluminous infrared galaxies . ApJS , 203 pp. 9, November 2012.
- [young_polarimetry_1996] S. Young, J. H. Hough, A. Efstathiou, B. J. Wills, J. A. Bailey, M. J. Ward, and D. J. Axon. Polarimetry and modelling of narrow-line active galaxies . MNRAS , 281 pp. 1206–1242, August 1996.
Images
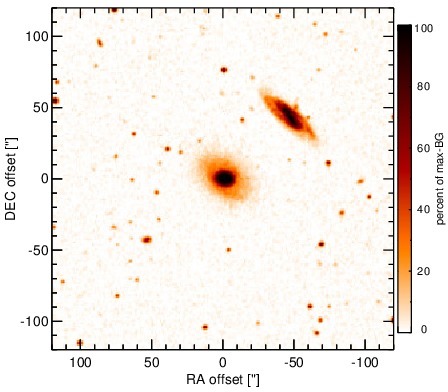
Optical image (DSS, red filter). Displayed are the central 4 arcmin with North being up and East to the left. The colour scaling is linear with white corresponding to the median background (BG) and black to the 0.01% pixels with the highest intensity.
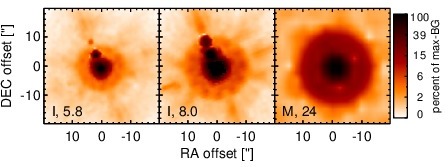
Spitzer MIR images. Displayed are the inner 40 arcsec with North being up and East to the left. The colour scaling is logarithmic with white corresponding to median BG and black to the 0.1% pixels with the highest intensity. The label in the bottom left states instrument and central wavelength of the filter in micron (I: IRAC, M: MIPS).
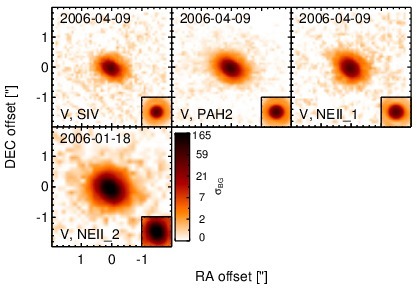
Subarcsecond-resolution MIR images sorted by increasing filter central wavelength. Displayed are the inner 4 arcsec with North being up and East to the left. The colour scaling is logarithmic with white corresponding to median BG and black to the 75% of the highest intensity of all images in units of sig_bg. The inset image (where present; either bottom or top right) shows the central arcsecond of the PSF from the calibrator star, scaled to match the science target. The labels in the bottom left state instrument and filter names (C: COMICS, M: Michelle, T: T-ReCS, V: VISIR).
SEDs
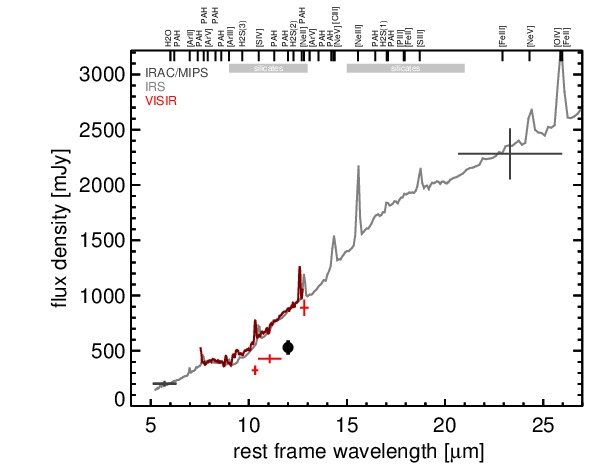
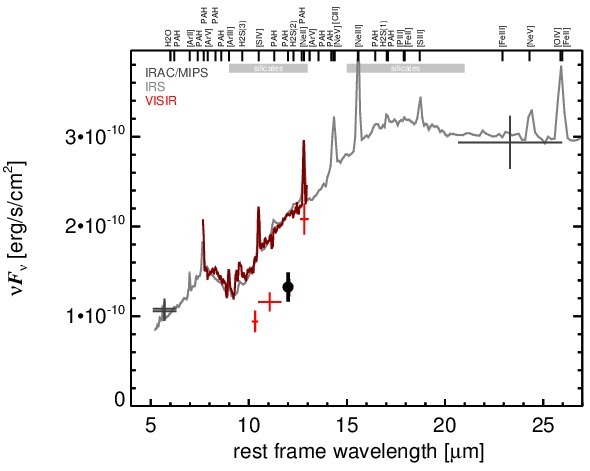
MIR SED. The description of the symbols in all the SED plots (where present) is the following: Grey crosses and solid lines mark the Spitzer/IRAC, MIPS and IRS data. The colour coding of the other symbols is as follows: green for COMICS, magenta for Michelle, blue for T-ReCS and red for VISIR data. Darker-coloured solid lines mark spectra of the corresponding instrument. The black filled circles mark the nuclear 12 and 18 micron continuum emission estimate from the data (where present). The ticks on the top axis mark positions of common MIR emission lines, while the light grey horizontal bars mark wavelength ranges affected by the silicate 10 and 18 micron features.