Sasmirala Individual Information for MCG-5-23-16
Description
MCG-5-23-16 is an early-type galaxy at a redshift of z = 0.0085 (D ~ 39.5 Mpc) with an AGN classified as a Sy 1.9 [wilson_kinematics_1985] with broad emission lines in the near-infrared [goodrich_infrared_1994]. It possesses an extended NLR on each side of the nucleus (~ 1arcsec ~ 190 pc; PA~ 40∘; [ferruit_hubble_2000]). MCG-5-23-16 was extensively studied in the X-rays and belongs to the nine-month BAT AGN sample. The first MIR observations were performed by [frogel_8-13_1982] and [glass_mid-infrared_1982], followed by first subarcsecond-resolution N-band imaging with ESO 3.6 m/TIMMI2 in 2002 [raban_core_2008]. An unresolved MIR nucleus was detected in the TIMMI2 images, which is also the case for the Spitzer/IRAC images where no host emission is evident. The IRS LR staring-mode spectrum shows silicate 10 μm absorption, very weak PAH emission, and a red spectral slope with an emission peak at ~ 18 μm in νFν-space (see also [weaver_mid-infrared_2010]). MCG-05-23-16 was observed with VISIR in three different narrow N-band filters in 2006 and 2007 [honig_dusty_2010-1, reunanen_vlt_2010] and in two Q-band filters in 2005 and 2007 ([reunanen_vlt_2010]; and unpublished, to our knowledge). In addition, a VISIR LR N-band spectrum was obtained in 2007 [honig_dusty_2010-1]. An unresolved MIR nucleus was detected in all images taken under good conditions, while the PAH1 and Q2 images suffer from non-diffraction-limited conditions. The VISIR spectrophotometry is consistent with the Spitzer spectrophotometry and also the older MIR photometry mentioned above. This indicates that there have been no significant flux changes over the last ~ 25 years. Note that the nucleus of MCG-5-23-16 was partly resolved with MIDI interferometric observations, which provides size constraints of 1.5 to 4 pc for the MIR emitter [tristram_parsec-scale_2009, burtscher_diversity_2013].
- [burtscher_diversity_2013] L. Burtscher, K. Meisenheimer, K. R. W. Tristram, W. Jaffe, S. F. Hönig, R. I. Davies, M. Kishimoto, J.-U. Pott, H. Röttgering, M. Schartmann, G. Weigelt, and S. Wolf. A diversity of dusty AGN tori. data release for the VLTI/MIDI AGN large program and first results for 23 galaxies . A&A , 558 pp. 149, October 2013.
- [ferruit_hubble_2000] Pierre Ferruit, Andrew S. Wilson, and John Mulchaey. Hubble space telescope WFPC2 imaging of a sample of early-type seyfert galaxies . ApJS , 128 pp. 139–169, May 2000.
- [frogel_8-13_1982] J. F. Frogel, J. H. Elias, and M. M. Phillips. 8-13 micron observations of nine emission-line galaxies . ApJ , 260 pp. 70–74, September 1982.
- [glass_mid-infrared_1982] I. S. Glass, A. F. M. Moorwood, and W. Eichendorf. Mid-infrared observations of seyfert 1 and narrow-line x-ray galaxies . A&A , 107 pp. 276–282, March 1982.
- [goodrich_infrared_1994] Robert W. Goodrich, Sylvain Veilleux, and Gary J. Hill. Infrared spectroscopy of seyfert 2 galaxies: A look through the obscuring torus? . ApJ , 422 pp. 521–536, February 1994.
- [honig_dusty_2010-1] S. F. Hönig, M. Kishimoto, P. Gandhi, A. Smette, D. Asmus, W. Duschl, M. Polletta, and G. Weigelt. The dusty heart of nearby active galaxies. i. high-spatial resolution mid-IR spectro-photometry of seyfert galaxies . A&A , 515 pp. 23, June 2010.
- [raban_core_2008] D. Raban, B. Heijligers, H. Röttgering, K. Meisenheimer, W. Jaffe, H. U. Käufl, and T. Henning. The core flux of the brightest 10 μm galaxies in the southern sky . A&A , 484 pp. 341–345, June 2008.
- [reunanen_vlt_2010] J. Reunanen, M. A. Prieto, and R. Siebenmorgen. VLT diffraction-limited imaging at 11 and 18μm of the nearest active galactic nuclei . MNRAS , 402 pp. 879–894, February 2010.
- [tristram_parsec-scale_2009] K. R. W. Tristram, D. Raban, K. Meisenheimer, W. Jaffe, H. Röttgering, L. Burtscher, W. D. Cotton, U. Graser, Th. Henning, Ch. Leinert, B. Lopez, S. Morel, G. Perrin, and M. Wittkowski. Parsec-scale dust distributions in seyfert galaxies. results of the MIDI AGN snapshot survey . A&A , 502 pp. 67–84, July 2009.
- [weaver_mid-infrared_2010] K. A. Weaver, M. Meléndez, R. F. Mushotzky, S. Kraemer, K. Engle, E. Malumuth, J. Tueller, C. Markwardt, C. T. Berghea, R. P. Dudik, L. M. Winter, and L. Armus. Mid-infrared properties of the swift burst alert telescope active galactic nuclei sample of the local universe. i. emission-line diagnostics . ApJ , 716 pp. 1151–1165, June 2010.
- [wilson_kinematics_1985] A. S. Wilson, J. A. Baldwin, and J. S. Ulvestad. Kinematics and ionization of extended ionized gas in active galaxies. i - the x-ray luminous galaxies NGC 2110, NGC 5506, and MCG -5-23-16 . ApJ , 291 pp. 627–654, April 1985.
Images
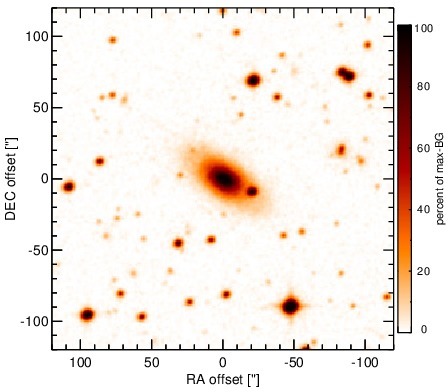
Optical image (DSS, red filter). Displayed are the central 4 arcmin with North being up and East to the left. The colour scaling is linear with white corresponding to the median background (BG) and black to the 0.01% pixels with the highest intensity.
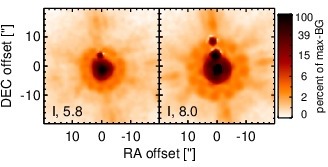
Spitzer MIR images. Displayed are the inner 40 arcsec with North being up and East to the left. The colour scaling is logarithmic with white corresponding to median BG and black to the 0.1% pixels with the highest intensity. The label in the bottom left states instrument and central wavelength of the filter in micron (I: IRAC, M: MIPS).
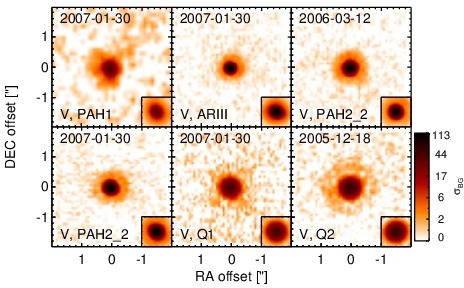
Subarcsecond-resolution MIR images sorted by increasing filter central wavelength. Displayed are the inner 4 arcsec with North being up and East to the left. The colour scaling is logarithmic with white corresponding to median BG and black to the 75% of the highest intensity of all images in units of sig_bg. The inset image (where present; either bottom or top right) shows the central arcsecond of the PSF from the calibrator star, scaled to match the science target. The labels in the bottom left state instrument and filter names (C: COMICS, M: Michelle, T: T-ReCS, V: VISIR).
SEDs
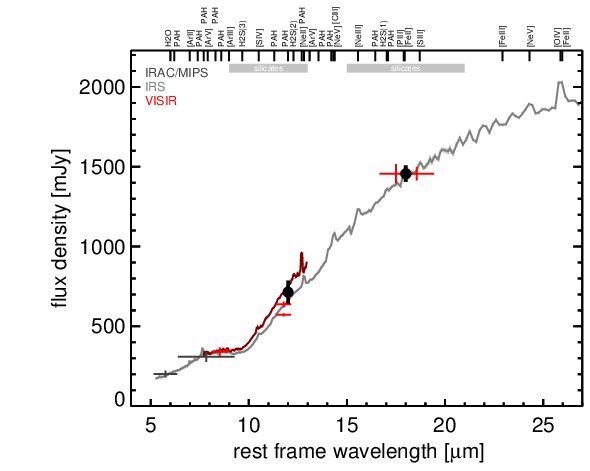
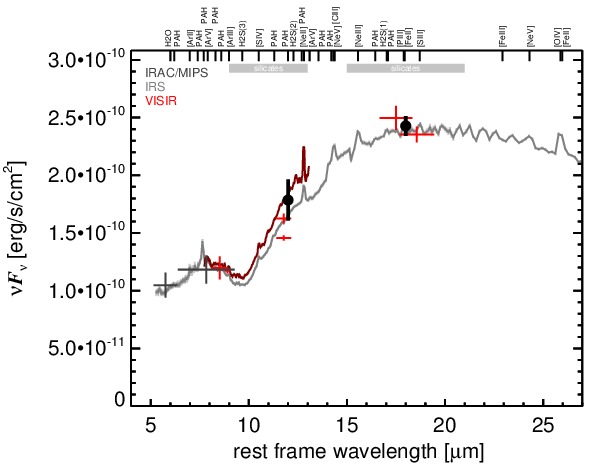
MIR SED. The description of the symbols in all the SED plots (where present) is the following: Grey crosses and solid lines mark the Spitzer/IRAC, MIPS and IRS data. The colour coding of the other symbols is as follows: green for COMICS, magenta for Michelle, blue for T-ReCS and red for VISIR data. Darker-coloured solid lines mark spectra of the corresponding instrument. The black filled circles mark the nuclear 12 and 18 micron continuum emission estimate from the data (where present). The ticks on the top axis mark positions of common MIR emission lines, while the light grey horizontal bars mark wavelength ranges affected by the silicate 10 and 18 micron features.