Sasmirala Individual Information for MCG-6-30-15
Description
MCG-6-30-15 is an elongated lenticular galaxy at a redshift of z = 0.0077 (D ~ 35.8 Mpc) with a Sy 1.5 nucleus [veron-cetty_catalogue_2010], which was discovered in X-rays [pineda_mcg_1978, pineda_x-ray_1980] and since then has been extensively studied in X-rays. MCG-6-30-15 also belongs to the nine-month BAT AGN sample. It possesses a NLR extending several hundreds of parsec with a PA~ 115∘ [ferruit_hubble_2000, schmitt_hubble_2003], while the radio emission is unresolved [nagar_radio_1999]. The first MIR observations of MCG-6-30-15 were performed by [glass_mid-infrared_1982] and [ward_continuum_1987]. After IRAS, ISO/ISOCAM produced MIR images in 1996 [ramos_almeida_mid-infrared_2007], while the first subarcsecond-resolution N-band imaging was obtained with Palomar 5 m/MIRLIN in 2000 by [gorjian_10_2004]. MCG-6-30-15 appears rather point-like in the Spitzer/IRAC and MIPS images and our IRAC 5.8 and 8.0 μm photometry agrees with the values by [gallimore_infrared_2010]. The Spitzer/IRS LR staring mode spectrum shows silicate 10 and 18 μm emission, weak PAH features and a rather flat spectral slope with an emission peak at ~ 18 μm in νFν-space (see also [buchanan_spitzer_2006, wu_spitzer/irs_2009, tommasin_spitzer-irs_2010, gallimore_infrared_2010, mullaney_defining_2011]). We observed MCG-6-30-15 with VISIR in three narrow N-band filters in 2006 [horst_mid_2008, horst_mid-infrared_2009] and obtained a VISIR LR N-band spectrum in 2009, while additional two narrow N-band images from 2010 are available (unpublished, to our knowledge). A compact MIR nucleus was detected in all images, which is possibly marginally resolved (FWHM ~ 0.37arcsec ~ 63 pc; PA~ 100∘). This would roughly coincide with the NLR extension. However, the uncertainties are too high to definitely classify the nucleus of MCG-6-30-15 as extended at subarcsecond resolution in the MIR. Our nuclear VISIR photometry is consistent with the Spitzer spectrophotometry and the VISIR spectrum from [honig_dusty_2010-1]. Apart from the significantly higher MIRLIN measurement, the MIR photometry obtained during the last ~ 25 years provides consistent results, indicating that MCG-6-30-15 is not significantly variable in the MIR.
- [buchanan_spitzer_2006] Catherine L. Buchanan, Jack F. Gallimore, Christopher P. O'Dea, Stefi A. Baum, David J. Axon, Andrew Robinson, Moshe Elitzur, and Martin Elvis. Spitzer IRS spectra of a large sample of seyfert galaxies: A variety of infrared spectral energy distributions in the local active galactic nucleus population . AJ , 132 pp. 401–419, July 2006.
- [ferruit_hubble_2000] Pierre Ferruit, Andrew S. Wilson, and John Mulchaey. Hubble space telescope WFPC2 imaging of a sample of early-type seyfert galaxies . ApJS , 128 pp. 139–169, May 2000.
- [gallimore_infrared_2010] J. F. Gallimore, A. Yzaguirre, J. Jakoboski, M. J. Stevenosky, D. J. Axon, S. A. Baum, C. L. Buchanan, M. Elitzur, M. Elvis, C. P. O'Dea, and A. Robinson. Infrared spectral energy distributions of seyfert galaxies: Spitzer space telescope observations of the 12 μm sample of active galaxies . ApJS , 187 pp. 172–211, March 2010.
- [glass_mid-infrared_1982] I. S. Glass, A. F. M. Moorwood, and W. Eichendorf. Mid-infrared observations of seyfert 1 and narrow-line x-ray galaxies . A&A , 107 pp. 276–282, March 1982.
- [gorjian_10_2004] V. Gorjian, M. W. Werner, T. H. Jarrett, D. M. Cole, and M. E. Ressler. 10 micron imaging of seyfert galaxies from the 12 micron sample . ApJ , 605 pp. 156–167, April 2004.
- [honig_dusty_2010-1] S. F. Hönig, M. Kishimoto, P. Gandhi, A. Smette, D. Asmus, W. Duschl, M. Polletta, and G. Weigelt. The dusty heart of nearby active galaxies. i. high-spatial resolution mid-IR spectro-photometry of seyfert galaxies . A&A , 515 pp. 23, June 2010.
- [horst_mid-infrared_2009] H. Horst, W. J. Duschl, P. Gandhi, and A. Smette. Mid-infrared imaging of 25 local AGN with VLT-VISIR . A&A , 495 pp. 137–146, February 2009.
- [horst_mid_2008] H. Horst, P. Gandhi, A. Smette, and W. J. Duschl. The mid IR - hard x-ray correlation in AGN and its implications for dusty torus models . A&A , 479 pp. 389–396, February 2008.
- [mullaney_defining_2011] J. R. Mullaney, D. M. Alexander, A. D. Goulding, and R. C. Hickox. Defining the intrinsic AGN infrared spectral energy distribution and measuring its contribution to the infrared output of composite galaxies . MNRAS , page 474, April 2011.
- [nagar_radio_1999] Neil M. Nagar, Andrew S. Wilson, John S. Mulchaey, and Jack F. Gallimore. Radio structures of seyfert galaxies. VIII. a distance- and magnitude-limited sample of early-type galaxies . ApJS , 120 pp. 209–245, February 1999.
- [pineda_mcg_1978] F. Pineda, J. Delvaille, J. Huchra, and M. Davis. MCG -6-30-15 . International Astronomical Union Circular , 3202 pp. 3, March 1978.
- [pineda_x-ray_1980] F. J. Pineda, J. P. Delvaille, H. W. Schnopper, and J. E. Grindlay. X-ray and optical observations of MCG-6-30-15 . ApJ , 237 pp. 414–417, April 1980.
- [ramos_almeida_mid-infrared_2007] C. Ramos Almeida, A. M. Pérez García, J. A. Acosta-Pulido, and J. M. Rodríguez Espinosa. The mid-infrared emission of seyfert galaxies: A new analysis of ISOCAM data . AJ , 134 pp. 2006–2019, November 2007.
- [schmitt_hubble_2003] H. R. Schmitt, J. L. Donley, R. R. J. Antonucci, J. B. Hutchings, and A. L. Kinney. A hubble space telescope survey of extended [o III] λ5007 emission in a far-infrared selected sample of seyfert galaxies: Observations . ApJS , 148 pp. 327–352, October 2003.
- [tommasin_spitzer-irs_2010] Silvia Tommasin, Luigi Spinoglio, Matthew A. Malkan, and Giovanni Fazio. Spitzer-IRS high-resolution spectroscopy of the 12 μm seyfert galaxies. II. results for the complete data set . ApJ , 709 pp. 1257–1283, February 2010.
- [veron-cetty_catalogue_2010] M.-P. Véron-Cetty and P. Véron. A catalogue of quasars and active nuclei: 13th edition . A&A , 518 pp. 10, July 2010.
- [ward_continuum_1987] Martin Ward, Martin Elvis, G. Fabbiano, N. P. Carleton, S. P. Willner, and A. Lawrence. The continuum of type 1 seyfert galaxies. i - a single form modified by the effects of dust . ApJ , 315 pp. 74–91, April 1987.
- [wu_spitzer/irs_2009] Yanling Wu, Vassilis Charmandaris, Jiasheng Huang, Luigi Spinoglio, and Silvia Tommasin. Spitzer/IRS 5-35 μm low-resolution spectroscopy of the 12 μm seyfert sample . ApJ , 701 pp. 658–676, August 2009.
Images
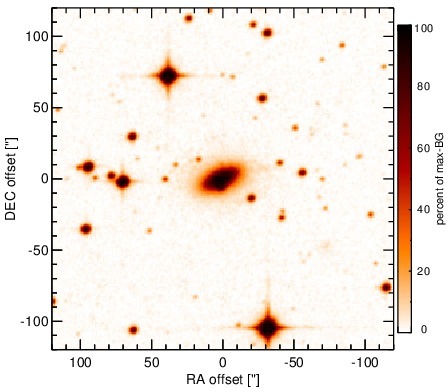
Optical image (DSS, red filter). Displayed are the central 4 arcmin with North being up and East to the left. The colour scaling is linear with white corresponding to the median background (BG) and black to the 0.01% pixels with the highest intensity.
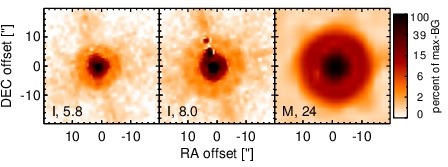
Spitzer MIR images. Displayed are the inner 40 arcsec with North being up and East to the left. The colour scaling is logarithmic with white corresponding to median BG and black to the 0.1% pixels with the highest intensity. The label in the bottom left states instrument and central wavelength of the filter in micron (I: IRAC, M: MIPS).
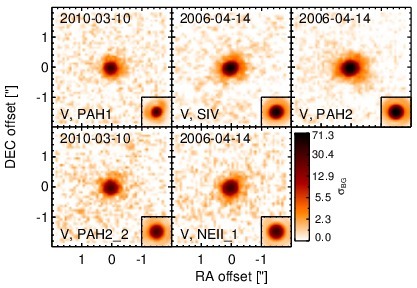
Subarcsecond-resolution MIR images sorted by increasing filter central wavelength. Displayed are the inner 4 arcsec with North being up and East to the left. The colour scaling is logarithmic with white corresponding to median BG and black to the 75% of the highest intensity of all images in units of sig_bg. The inset image (where present; either bottom or top right) shows the central arcsecond of the PSF from the calibrator star, scaled to match the science target. The labels in the bottom left state instrument and filter names (C: COMICS, M: Michelle, T: T-ReCS, V: VISIR).
SEDs
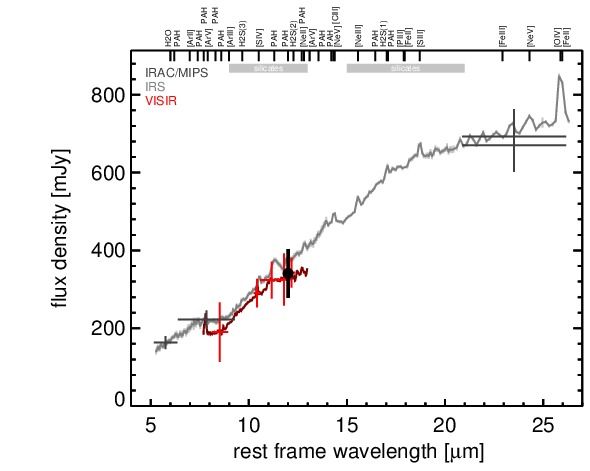
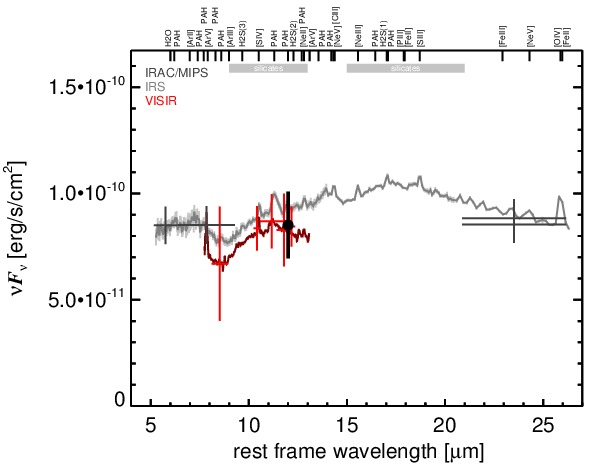
MIR SED. The description of the symbols in all the SED plots (where present) is the following: Grey crosses and solid lines mark the Spitzer/IRAC, MIPS and IRS data. The colour coding of the other symbols is as follows: green for COMICS, magenta for Michelle, blue for T-ReCS and red for VISIR data. Darker-coloured solid lines mark spectra of the corresponding instrument. The black filled circles mark the nuclear 12 and 18 micron continuum emission estimate from the data (where present). The ticks on the top axis mark positions of common MIR emission lines, while the light grey horizontal bars mark wavelength ranges affected by the silicate 10 and 18 micron features.