Sasmirala Individual Information for Mrk 1014
Description
Mrk 1014 is a disturbed face-on ultra-luminous infrared spiral galaxy at a redshift of z = 0.1631 (D ~748 Mpc) with a radio-quiet quasar-type AGN optically classified as a Sy 1.5 [veron-cetty_catalogue_2010]. It features a very extended and complex NLR with two arcsecond (~ 5.4 kpc; PA~ 90∘; e.g., [bennert_size_2002]) coinciding with the radio emission structure (e.g., [leipski_radio_2006]). After the discovery of its MIR brightness through IRAS, Mrk 1014 was monitored with ground-based N-band photometry [neugebauer_continuum_1987, neugebauer_variability_1999]. It was also observed with ISO in different modes [rigopoulou_large_1999, sturm_mid-infrared_2002, haas_iso_2003] and Spitzer/IRAC and IRS. Mark 1014 appears point-like in all corresponding images, while the IRS LR staring-mode spectrum shows extremely weak silicate 10 μm emission, weak PAH features and a red slope in νFν-space (see also [armus_observations_2004, armus_observations_2007, farrah_high-resolution_2007, cao_mid-infrared_2008]). Thus, the MIR SED appears AGN-dominated. Mrk 1014 was observed with COMICS in the N11.7 filter in 2006 [imanishi_subaru_2011]. In the image, a marginally resolved and elongated MIR nucleus was detected (FWHM ~ 0.58arcsec ~ 1.9 pc; PA~ 63∘). However, at least a second epoch of subarcsecond MIR imaging is required to verify this extension. Our measured nuclear N11.7 flux is 25% higher than that of [imanishi_subaru_2011] but consistent with the previous N-band photometry and the Spitzer spectrophotometry. Therefore, we use the IRS spectrum to compute the nuclear 12 μm continuum emission estimate.
- [armus_observations_2004] L. Armus, V. Charmandaris, H. W. W. Spoon, J. R. Houck, B. T. Soifer, B. R. Brandl, P. N. Appleton, H. I. Teplitz, S. J. U. Higdon, D. W. Weedman, D. Devost, P. W. Morris, K. I. Uchida, J. van Cleve, D. J. Barry, G. C. Sloan, C. J. Grillmair, M. J. Burgdorf, S. B. Fajardo-Acosta, J. G. Ingalls, J. Higdon, L. Hao, J. Bernard-Salas, T. Herter, J. Troeltzsch, B. Unruh, and M. Winghart. Observations of ultraluminous infrared galaxies with the infrared spectrograph (IRS) on the spitzer space telescope: Early results on markarian 1014, markarian 463, and UGC 5101 . ApJS , 154 pp. 178–183, September 2004.
- [armus_observations_2007] L. Armus, V. Charmandaris, J. Bernard-Salas, H. W. W. Spoon, J. A. Marshall, S. J. U. Higdon, V. Desai, H. I. Teplitz, L. Hao, D. Devost, B. R. Brandl, Y. Wu, G. C. Sloan, B. T. Soifer, J. R. Houck, and T. L. Herter. Observations of ultraluminous infrared galaxies with the infrared spectrograph on the spitzer space telescope. II. the IRAS bright galaxy sample . ApJ , 656 pp. 148–167, February 2007.
- [bennert_size_2002] Nicola Bennert, Heino Falcke, Hartmut Schulz, Andrew S. Wilson, and Beverley J. Wills. Size and structure of the narrow-line region of quasars . ApJL , 574 pp. L105–L109, August 2002.
- [cao_mid-infrared_2008] Chen Cao, X. Y. Xia, Hong Wu, S. Mao, C. N. Hao, and Z. G. Deng. Mid-infrared spectroscopic properties of ultra-luminous infrared quasars . MNRAS , 390 pp. 336–348, October 2008.
- [farrah_high-resolution_2007] D. Farrah, J. Bernard-Salas, H. W. W. Spoon, B. T. Soifer, L. Armus, B. Brandl, V. Charmandaris, V. Desai, S. Higdon, D. Devost, and J. Houck. High-resolution mid-infrared spectroscopy of ultraluminous infrared galaxies . ApJ , 667 pp. 149–169, September 2007.
- [haas_iso_2003] M. Haas, U. Klaas, S. A. H. Müller, F. Bertoldi, M. Camenzind, R. Chini, O. Krause, D. Lemke, K. Meisenheimer, P. J. Richards, and B. J. Wilkes. The ISO view of palomar-green quasars . A&A , 402 pp. 87–111, April 2003.
- [imanishi_subaru_2011] Masatoshi Imanishi, Keisuke Imase, Nagisa Oi, and Kohei Ichikawa. Subaru and gemini high spatial resolution infrared 18 μm imaging observations of nearby luminous infrared galaxies . AJ , 141 pp. 156, May 2011.
- [leipski_radio_2006] C. Leipski, H. Falcke, N. Bennert, and S. Hüttemeister. The radio structure of radio-quiet quasars . A&A , 455 pp. 161–172, August 2006.
- [neugebauer_continuum_1987] G. Neugebauer, R. F. Green, K. Matthews, M. Schmidt, B. T. Soifer, and J. Bennett. Continuum energy distributions of quasars in the palomar-green survey . ApJS , 63 pp. 615–644, March 1987.
- [neugebauer_variability_1999] G. Neugebauer and K. Matthews. Variability of quasars at 10 microns . AJ , 118 pp. 35–45, July 1999.
- [rigopoulou_large_1999] D. Rigopoulou, H. W. W. Spoon, R. Genzel, D. Lutz, A. F. M. Moorwood, and Q. D. Tran. A large mid-infrared spectroscopic and near-infrared imaging survey of ultraluminous infrared galaxies: Their nature and evolution . AJ , 118 pp. 2625–2645, December 1999.
- [sturm_mid-infrared_2002] E. Sturm, D. Lutz, A. Verma, H. Netzer, A. Sternberg, A. F. M. Moorwood, E. Oliva, and R. Genzel. Mid-infrared line diagnostics of active galaxies. a spectroscopic AGN survey with ISO-SWS . A&A , 393 pp. 821–841, October 2002.
- [veron-cetty_catalogue_2010] M.-P. Véron-Cetty and P. Véron. A catalogue of quasars and active nuclei: 13th edition . A&A , 518 pp. 10, July 2010.
Images
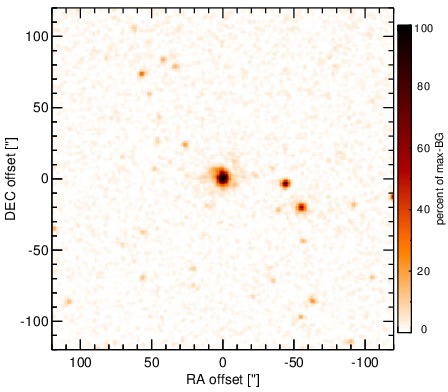
Optical image (DSS, red filter). Displayed are the central 4 arcmin with North being up and East to the left. The colour scaling is linear with white corresponding to the median background (BG) and black to the 0.01% pixels with the highest intensity.
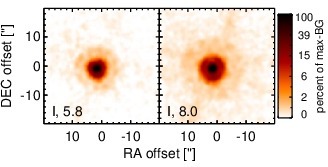
Spitzer MIR images. Displayed are the inner 40 arcsec with North being up and East to the left. The colour scaling is logarithmic with white corresponding to median BG and black to the 0.1% pixels with the highest intensity. The label in the bottom left states instrument and central wavelength of the filter in micron (I: IRAC, M: MIPS).
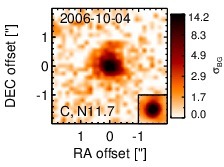
Subarcsecond-resolution MIR images sorted by increasing filter central wavelength. Displayed are the inner 4 arcsec with North being up and East to the left. The colour scaling is logarithmic with white corresponding to median BG and black to the 75% of the highest intensity of all images in units of sig_bg. The inset image (where present; either bottom or top right) shows the central arcsecond of the PSF from the calibrator star, scaled to match the science target. The labels in the bottom left state instrument and filter names (C: COMICS, M: Michelle, T: T-ReCS, V: VISIR).
SEDs
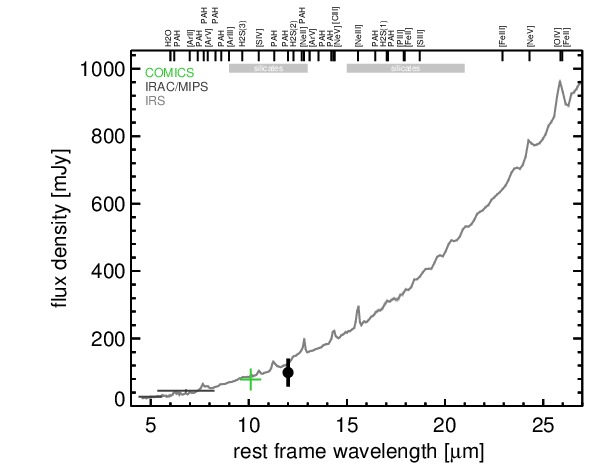
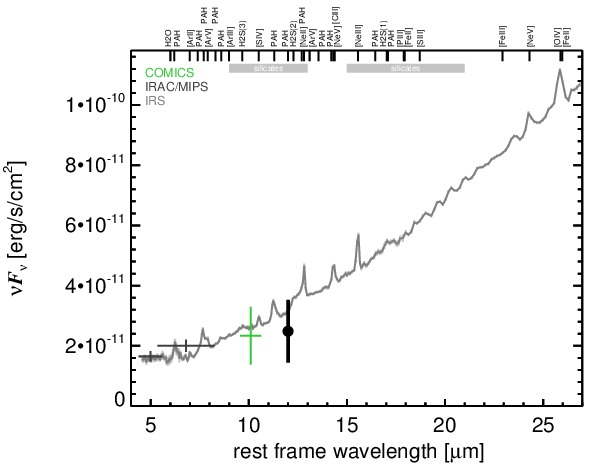
MIR SED. The description of the symbols in all the SED plots (where present) is the following: Grey crosses and solid lines mark the Spitzer/IRAC, MIPS and IRS data. The colour coding of the other symbols is as follows: green for COMICS, magenta for Michelle, blue for T-ReCS and red for VISIR data. Darker-coloured solid lines mark spectra of the corresponding instrument. The black filled circles mark the nuclear 12 and 18 micron continuum emission estimate from the data (where present). The ticks on the top axis mark positions of common MIR emission lines, while the light grey horizontal bars mark wavelength ranges affected by the silicate 10 and 18 micron features.