Sasmirala Individual Information for Mrk 1239
Description
Mrk 1239 is an elliptical galaxy at a redshift of z = 0.0199 (D ~88 Mpc) with an AGN classified as a Sy 1.5 and Sy 1n [veron-cetty_catalogue_2010]. This object has a steep radio spectrum with an unresolved core [ulvestad_radio_1995] and an extended NLR (diameter~ 10arcsec ~ 4.1 kpc; PA~ 11∘; [mulchaey_emission-line_1996]). After IRAS, ground-based MIR observations of Mrk 1239 were performed by [maiolino_new_1995]. The first subarcsecond-resolution N-band imaging was done with Palomar 5 m/MIRLIN [gorjian_10_2004], and with ESO 3.6 m/TIMMI2 [raban_core_2008]. In the MIRLIN image, a compact MIR nucleus with extended emission with ~ 1arcsec to the north-west was detected, while in the TIMMI2 image elongated emission rather coinciding with the NLR was detected. Then, the object appears rather point-like in the Spitzer/IRAC images. The nuclear source is saturated in the PBCD version of the latter and thus not analysed (but see [gallimore_infrared_2010]). In addition, a Spitzer/IRS LR staring mode spectrum is of Mrk 1239 is available and shows silicate 10 and 18 μm emission, very weak PAH features and a blue spectral slope in νFν-space (see also [wu_spitzer/irs_2009, tommasin_spitzer-irs_2010, gallimore_infrared_2010]). Mrk 1239 was observed with VISIR in PAH2 in 2005 [haas_visir_2007], and with PAH2_2 and Q2 in 2006 [reunanen_vlt_2010]. The MIR nucleus appears compact in all images but possibly marginally resolved in the sharpest image (PAH2_2; FWHM~ 0.33arcsec; PA~ 85∘). Our nuclear MIR photometry is on average ~ 10% higher than the literature values but mostly consistent with the IRS spectrum. Neither the structure of the MIRLIN nor of the TIMMI2 image are visible in the VISIR images. Therefore, it remains unclear, whether weak non-nuclear emission truly exists in Mrk 1239. Interestingly, the MIRLIN flux is at least 50% lower than all the other measurements. Note that the nucleus of Mrk 1239 was also been observed interferometrically with MIDI, where it remained essentially unresolved, implying a physical size of less than 7 pc for the MIR emitter [tristram_parsec-scale_2009, burtscher_diversity_2013].
- [burtscher_diversity_2013] L. Burtscher, K. Meisenheimer, K. R. W. Tristram, W. Jaffe, S. F. Hönig, R. I. Davies, M. Kishimoto, J.-U. Pott, H. Röttgering, M. Schartmann, G. Weigelt, and S. Wolf. A diversity of dusty AGN tori. data release for the VLTI/MIDI AGN large program and first results for 23 galaxies . A&A , 558 pp. 149, October 2013.
- [gallimore_infrared_2010] J. F. Gallimore, A. Yzaguirre, J. Jakoboski, M. J. Stevenosky, D. J. Axon, S. A. Baum, C. L. Buchanan, M. Elitzur, M. Elvis, C. P. O'Dea, and A. Robinson. Infrared spectral energy distributions of seyfert galaxies: Spitzer space telescope observations of the 12 μm sample of active galaxies . ApJS , 187 pp. 172–211, March 2010.
- [gorjian_10_2004] V. Gorjian, M. W. Werner, T. H. Jarrett, D. M. Cole, and M. E. Ressler. 10 micron imaging of seyfert galaxies from the 12 micron sample . ApJ , 605 pp. 156–167, April 2004.
- [haas_visir_2007] M. Haas, R. Siebenmorgen, E. Pantin, H. Horst, A. Smette, H.-U. Käufl, P.-O. Lagage, and R. Chini. VISIR / VLT mid-infrared imaging of seyfert nuclei: nuclear dust emission and the seyfert-2 dichotomy . A&A , 473 pp. 369–376, October 2007.
- [maiolino_new_1995] R. Maiolino, M. Ruiz, G. H. Rieke, and L. D. Keller. New constraints on the unified model of seyfert galaxies . ApJ , 446 pp. 561, June 1995.
- [mulchaey_emission-line_1996] John S. Mulchaey, Andrew S. Wilson, and Zlatan Tsvetanov. An emission-line imaging survey of early-type seyfert galaxies. i. the observations . ApJS , 102 pp. 309, February 1996.
- [raban_core_2008] D. Raban, B. Heijligers, H. Röttgering, K. Meisenheimer, W. Jaffe, H. U. Käufl, and T. Henning. The core flux of the brightest 10 μm galaxies in the southern sky . A&A , 484 pp. 341–345, June 2008.
- [reunanen_vlt_2010] J. Reunanen, M. A. Prieto, and R. Siebenmorgen. VLT diffraction-limited imaging at 11 and 18μm of the nearest active galactic nuclei . MNRAS , 402 pp. 879–894, February 2010.
- [tommasin_spitzer-irs_2010] Silvia Tommasin, Luigi Spinoglio, Matthew A. Malkan, and Giovanni Fazio. Spitzer-IRS high-resolution spectroscopy of the 12 μm seyfert galaxies. II. results for the complete data set . ApJ , 709 pp. 1257–1283, February 2010.
- [tristram_parsec-scale_2009] K. R. W. Tristram, D. Raban, K. Meisenheimer, W. Jaffe, H. Röttgering, L. Burtscher, W. D. Cotton, U. Graser, Th. Henning, Ch. Leinert, B. Lopez, S. Morel, G. Perrin, and M. Wittkowski. Parsec-scale dust distributions in seyfert galaxies. results of the MIDI AGN snapshot survey . A&A , 502 pp. 67–84, July 2009.
- [ulvestad_radio_1995] James S. Ulvestad, Robert R. J. Antonucci, and Robert W. Goodrich. Radio properties of narrow-lined seyfert 1 galaxies . AJ , 109 pp. 81–86, January 1995.
- [veron-cetty_catalogue_2010] M.-P. Véron-Cetty and P. Véron. A catalogue of quasars and active nuclei: 13th edition . A&A , 518 pp. 10, July 2010.
- [wu_spitzer/irs_2009] Yanling Wu, Vassilis Charmandaris, Jiasheng Huang, Luigi Spinoglio, and Silvia Tommasin. Spitzer/IRS 5-35 μm low-resolution spectroscopy of the 12 μm seyfert sample . ApJ , 701 pp. 658–676, August 2009.
Images
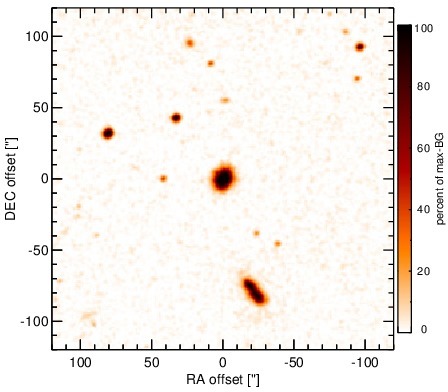
Optical image (DSS, red filter). Displayed are the central 4 arcmin with North being up and East to the left. The colour scaling is linear with white corresponding to the median background (BG) and black to the 0.01% pixels with the highest intensity.
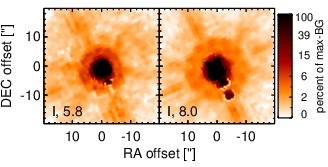
Spitzer MIR images. Displayed are the inner 40 arcsec with North being up and East to the left. The colour scaling is logarithmic with white corresponding to median BG and black to the 0.1% pixels with the highest intensity. The label in the bottom left states instrument and central wavelength of the filter in micron (I: IRAC, M: MIPS).
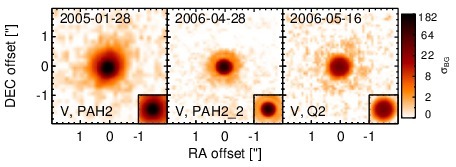
Subarcsecond-resolution MIR images sorted by increasing filter central wavelength. Displayed are the inner 4 arcsec with North being up and East to the left. The colour scaling is logarithmic with white corresponding to median BG and black to the 75% of the highest intensity of all images in units of sig_bg. The inset image (where present; either bottom or top right) shows the central arcsecond of the PSF from the calibrator star, scaled to match the science target. The labels in the bottom left state instrument and filter names (C: COMICS, M: Michelle, T: T-ReCS, V: VISIR).
SEDs
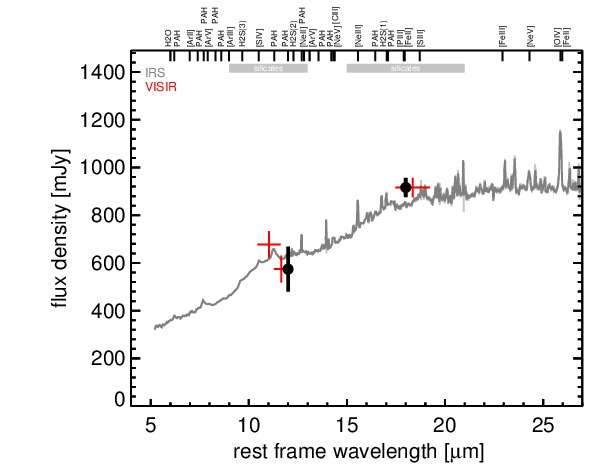
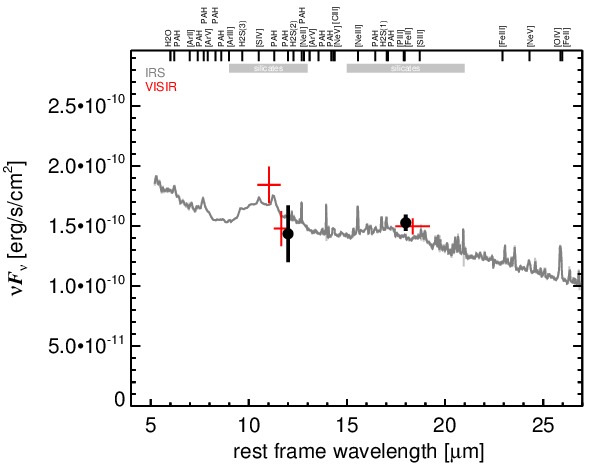
MIR SED. The description of the symbols in all the SED plots (where present) is the following: Grey crosses and solid lines mark the Spitzer/IRAC, MIPS and IRS data. The colour coding of the other symbols is as follows: green for COMICS, magenta for Michelle, blue for T-ReCS and red for VISIR data. Darker-coloured solid lines mark spectra of the corresponding instrument. The black filled circles mark the nuclear 12 and 18 micron continuum emission estimate from the data (where present). The ticks on the top axis mark positions of common MIR emission lines, while the light grey horizontal bars mark wavelength ranges affected by the silicate 10 and 18 micron features.