Sasmirala Individual Information for Mrk 266SW
Description
Mrk 266 is an infrared-luminous merger system consisting of two spirals at a redshift 0.0279 (D ~ 119 Mpc) with their nuclei separated by ~ 10arcsec (~ 5.5 kpc; PA~ 30∘; [kollatschny_double_1984]; see [mazzarella_investigation_2012] for a recent detailed study). The nucleus, Mrk 266SW is optically classified as a Sy 2 [veron-cetty_catalogue_2010], while the north-eastern, Mrk 266NE has LINER and AGN/starburst composite classifications [yuan_role_2010]. Water maser emission was detected in Mrk 266 [braatz_green_2004]. The first MIR observations of Mrk 266NE were performed with the Palomar 5 m bolometer [carico_iras_1988]. It is unclear which nucleus was targeted by the following MMT bolometer MIR observations published in [maiolino_new_1995]. ISO/ISOCAM observations of Mrk 266 are presented in [ramos_almeida_mid-infrared_2007], while the first subarcsecond-resolution N-band imaging performed with Palomar 5 m/MIRLIN is reported in [gorjian_10_2004] but without any description of the morphology or which nucleus was measured. Spitzer/IRAC, IRS and MIPS data for both nuclei are presented and analysed in [mazzarella_investigation_2012]. The Spitzer/IRAC and MIPS images show both nuclei as compact sources. The brighter southern nucleus is however slightly elongated (major axis~ 7arcsec ~ 3.8 kpc; PA~ 170∘). The IRS LR mapping-mode spectra of both nuclei resemble typical star formation MIR SEDs with weak silicate 10 μm absorption and PAH emission features, while the features are weaker for the northern nucleus. Mrk 266 was observed with COMICS in the N8.8 filter in 2009 [imanishi_subaru_2011]. Both nuclei are weakly detected in the image, the Mrk 266NE appears compact but fainter than Mrk 266SW, which is clearly extended (major axis ~ 3.5arcsec ~ 1.9 kpc; PA~ 170∘)). The low S/N of the detection prevents the extension analysis of Mrk 266NE. Our reanalysis of the image provides nuclear fluxes consistent with [imanishi_subaru_2011] and significantly lower than the Spitzer spectrophotometry.
- [braatz_green_2004] J. A. Braatz, C. Henkel, L. J. Greenhill, J. M. Moran, and A. S. Wilson. A green bank telescope search for water masers in nearby active galactic nuclei . ApJL , 617 pp. L29–L32, December 2004.
- [carico_iras_1988] David P. Carico, D. B. Sanders, B. T. Soifer, J. H. Elias, K. Matthews, and G. Neugebauer. The IRAS bright galaxy sample. III - 1-10 micron observations and coadded IRAS data for galaxies with l(IR) equal to or greater than 10 to the 11th solar luminosities . AJ , 95 pp. 356–373, February 1988.
- [gorjian_10_2004] V. Gorjian, M. W. Werner, T. H. Jarrett, D. M. Cole, and M. E. Ressler. 10 micron imaging of seyfert galaxies from the 12 micron sample . ApJ , 605 pp. 156–167, April 2004.
- [imanishi_subaru_2011] Masatoshi Imanishi, Keisuke Imase, Nagisa Oi, and Kohei Ichikawa. Subaru and gemini high spatial resolution infrared 18 μm imaging observations of nearby luminous infrared galaxies . AJ , 141 pp. 156, May 2011.
- [kollatschny_double_1984] W. Kollatschny and K. J. Fricke. The double seyfert nucleus of MKN 266 . A&A , 135 pp. 171–175, June 1984.
- [maiolino_new_1995] R. Maiolino, M. Ruiz, G. H. Rieke, and L. D. Keller. New constraints on the unified model of seyfert galaxies . ApJ , 446 pp. 561, June 1995.
- [mazzarella_investigation_2012] J. M. Mazzarella, K. Iwasawa, T. Vavilkin, L. Armus, D.-C. Kim, G. Bothun, A. S. Evans, H. W. W. Spoon, S. Haan, J. H. Howell, S. Lord, J. A. Marshall, C. M. Ishida, C. K. Xu, A. Petric, D. B. Sanders, J. A. Surace, P. Appleton, B. H. P. Chan, D. T. Frayer, H. Inami, E. Ye. Khachikian, B. F. Madore, G. C. Privon, E. Sturm, Vivian U, and S. Veilleux. Investigation of dual active nuclei, outflows, shock-heated gas, and young star clusters in markarian 266 . AJ , 144 pp. 125, November 2012.
- [ramos_almeida_mid-infrared_2007] C. Ramos Almeida, A. M. Pérez García, J. A. Acosta-Pulido, and J. M. Rodríguez Espinosa. The mid-infrared emission of seyfert galaxies: A new analysis of ISOCAM data . AJ , 134 pp. 2006–2019, November 2007.
- [veron-cetty_catalogue_2010] M.-P. Véron-Cetty and P. Véron. A catalogue of quasars and active nuclei: 13th edition . A&A , 518 pp. 10, July 2010.
- [yuan_role_2010] T.-T. Yuan, L. J. Kewley, and D. B. Sanders. The role of starburst-active galactic nucleus composites in luminous infrared galaxy mergers: Insights from the new optical classification scheme . ApJ , 709 pp. 884–911, February 2010.
Images
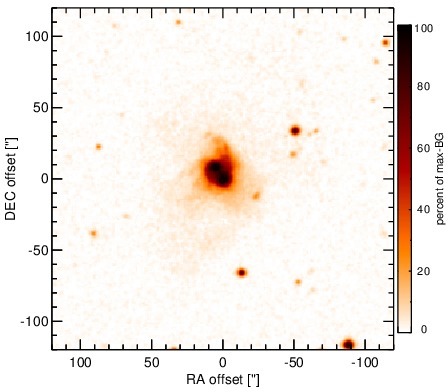
Optical image (DSS, red filter). Displayed are the central 4 arcmin with North being up and East to the left. The colour scaling is linear with white corresponding to the median background (BG) and black to the 0.01% pixels with the highest intensity.
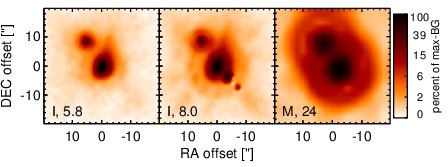
Spitzer MIR images. Displayed are the inner 40 arcsec with North being up and East to the left. The colour scaling is logarithmic with white corresponding to median BG and black to the 0.1% pixels with the highest intensity. The label in the bottom left states instrument and central wavelength of the filter in micron (I: IRAC, M: MIPS).
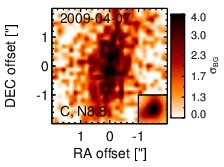
Subarcsecond-resolution MIR images sorted by increasing filter central wavelength. Displayed are the inner 4 arcsec with North being up and East to the left. The colour scaling is logarithmic with white corresponding to median BG and black to the 75% of the highest intensity of all images in units of sig_bg. The inset image (where present; either bottom or top right) shows the central arcsecond of the PSF from the calibrator star, scaled to match the science target. The labels in the bottom left state instrument and filter names (C: COMICS, M: Michelle, T: T-ReCS, V: VISIR).
SEDs
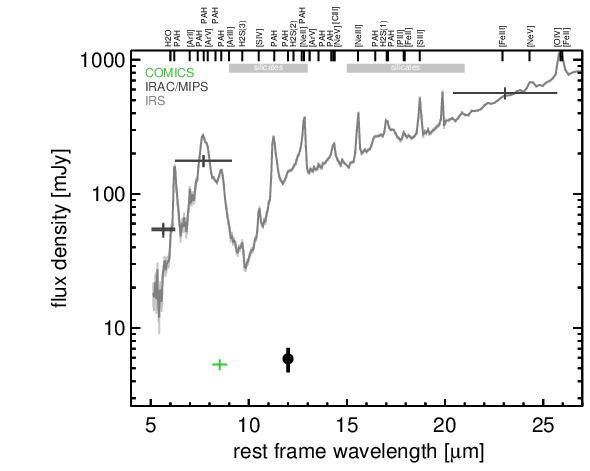
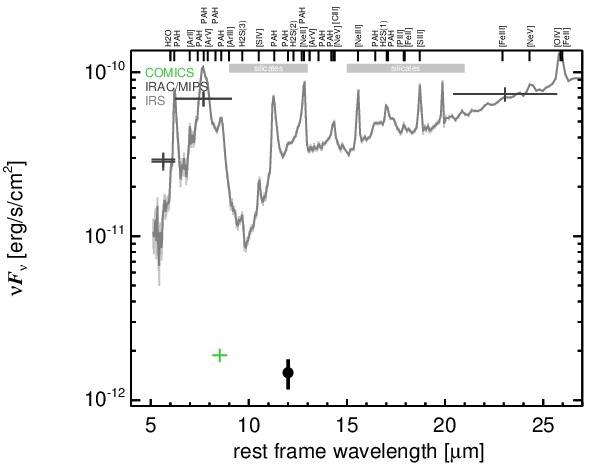
MIR SED. The description of the symbols in all the SED plots (where present) is the following: Grey crosses and solid lines mark the Spitzer/IRAC, MIPS and IRS data. The colour coding of the other symbols is as follows: green for COMICS, magenta for Michelle, blue for T-ReCS and red for VISIR data. Darker-coloured solid lines mark spectra of the corresponding instrument. The black filled circles mark the nuclear 12 and 18 micron continuum emission estimate from the data (where present). The ticks on the top axis mark positions of common MIR emission lines, while the light grey horizontal bars mark wavelength ranges affected by the silicate 10 and 18 micron features.