Sasmirala Individual Information for Mrk 3
Description
Mrk 3 is an early-type galaxy at a redshift of z = 0.0135 (D ~ 56 Mpc) with an AGN classified as a Sy 2 [khachikian_atlas_1974] with polarized broad emission lines [miller_spectropolarimetry_1990]. It is also a member of the nine-month BAT AGN sample. Mrk 3 possesses a slightly bended, collimated radio jet with a total extend of ~ 2arcsec (~ 530pc; PA~ 84∘; [kukula_high-resolution_1993]), and an extended NLR with ~ 2.1arcsec diameter, which coincides with the radio emission (~ 555pc; PA~ 70∘; [capetti_morphology_1995, schmitt_comparison_1996]). In addition, water maser emission was detected in Mrk 3 [braatz_green_2004]. The first MIR observations of Mrk 3 were performed by [neugebauer_optical_1976] and [rieke_infrared_1978], followed by ISO/ISOCAM observations after IRAS [ramos_almeida_mid-infrared_2007]. In the Spitzer/IRAC and MIPS images, Mrk 3 appears rather point-like, and the Spitzer/IRS LR staring-mode spectrum shows weak silicate 10 μm absorption, strong forbidden emission lines, and a steep spectral slope with an emission peak at ~ 18 μm in νFν-space (see also [weedman_mid-infrared_2005, deo_mid-infrared_2009, mullaney_defining_2011]). Mrk 3 was observed with Michelle in the Si-5 filter in 2010 (unpublished, to our knowledge). An elongated nucleus was detected (FWHM(major axis)~ 0.65arcsec ~ 170 pc; PA~ 70∘), which matches the NLR and radio elongation. However, at least a second epoch of subarcsecond MIR imaging is required to verify this extension. Our total nuclear photometry is consistent with the Spitzer spectrophotometry.
- [braatz_green_2004] J. A. Braatz, C. Henkel, L. J. Greenhill, J. M. Moran, and A. S. Wilson. A green bank telescope search for water masers in nearby active galactic nuclei . ApJL , 617 pp. L29–L32, December 2004.
- [capetti_morphology_1995] A. Capetti, F. Macchetto, D. J. Axon, W. B. Sparks, and A. Boksenberg. The morphology of the narrow-line region of markarian 3 . ApJ , 448 pp. 600, August 1995.
- [deo_mid-infrared_2009] Rajesh P. Deo, Gordon T. Richards, D. M. Crenshaw, and S. B. Kraemer. The mid-infrared continua of seyfert galaxies . ApJ , 705 pp. 14–31, November 2009.
- [khachikian_atlas_1974] E. Y. Khachikian and D. W. Weedman. An atlas of seyfert galaxies . ApJ , 192 pp. 581–589, September 1974.
- [kukula_high-resolution_1993] M. J. Kukula, T. Ghosh, A. Pedlar, R. T. Schilizzi, G. K. Miley, A. G. de Bruyn, and D. J. Saikia. High-resolution radio observations of MARKARIAN:3 . MNRAS , 264 pp. 893, October 1993.
- [miller_spectropolarimetry_1990] J. S. Miller and R. W. Goodrich. Spectropolarimetry of high-polarization seyfert 2 galaxies and unified seyfert theories . ApJ , 355 pp. 456–467, June 1990.
- [mullaney_defining_2011] J. R. Mullaney, D. M. Alexander, A. D. Goulding, and R. C. Hickox. Defining the intrinsic AGN infrared spectral energy distribution and measuring its contribution to the infrared output of composite galaxies . MNRAS , page 474, April 2011.
- [neugebauer_optical_1976] G. Neugebauer, E. E. Becklin, J. B. Oke, and L. Searle. Optical and infrared spectrophotometry of 18 markarian galaxies . ApJ , 205 pp. 29–43, April 1976.
- [ramos_almeida_mid-infrared_2007] C. Ramos Almeida, A. M. Pérez García, J. A. Acosta-Pulido, and J. M. Rodríguez Espinosa. The mid-infrared emission of seyfert galaxies: A new analysis of ISOCAM data . AJ , 134 pp. 2006–2019, November 2007.
- [rieke_infrared_1978] G. H. Rieke. The infrared emission of seyfert galaxies . ApJ , 226 pp. 550–558, December 1978.
- [schmitt_comparison_1996] Henrique R. Schmitt and Anne L. Kinney. A comparison between the narrow-line regions of seyfert 1 and seyfert 2 galaxies . ApJ , 463 pp. 498, June 1996.
- [weedman_mid-infrared_2005] D. W. Weedman, Lei Hao, S. J. U. Higdon, D. Devost, Yanling Wu, V. Charmandaris, B. Brandl, E. Bass, and J. R. Houck. Mid-infrared spectra of classical AGNs observed with the spitzer space telescope . ApJ , 633 pp. 706–716, November 2005.
Images
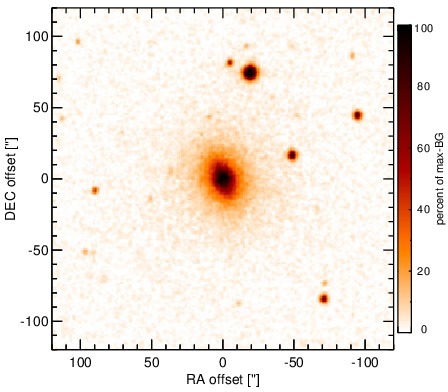
Optical image (DSS, red filter). Displayed are the central 4 arcmin with North being up and East to the left. The colour scaling is linear with white corresponding to the median background (BG) and black to the 0.01% pixels with the highest intensity.
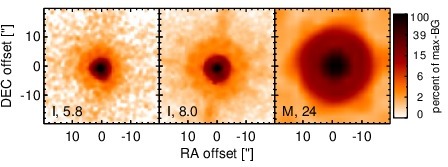
Spitzer MIR images. Displayed are the inner 40 arcsec with North being up and East to the left. The colour scaling is logarithmic with white corresponding to median BG and black to the 0.1% pixels with the highest intensity. The label in the bottom left states instrument and central wavelength of the filter in micron (I: IRAC, M: MIPS).
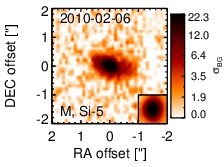
Subarcsecond-resolution MIR images sorted by increasing filter central wavelength. Displayed are the inner 4 arcsec with North being up and East to the left. The colour scaling is logarithmic with white corresponding to median BG and black to the 75% of the highest intensity of all images in units of sig_bg. The inset image (where present; either bottom or top right) shows the central arcsecond of the PSF from the calibrator star, scaled to match the science target. The labels in the bottom left state instrument and filter names (C: COMICS, M: Michelle, T: T-ReCS, V: VISIR).
SEDs
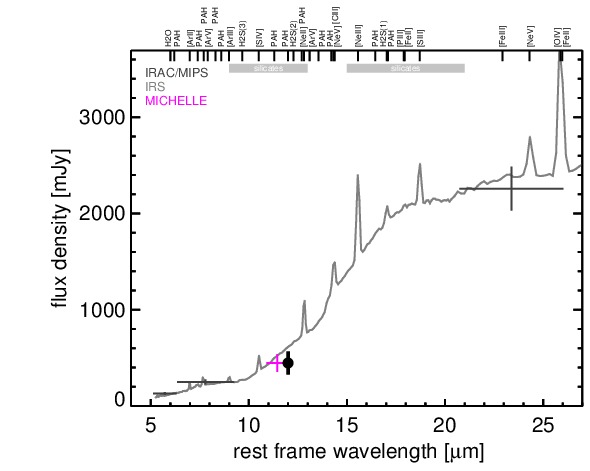
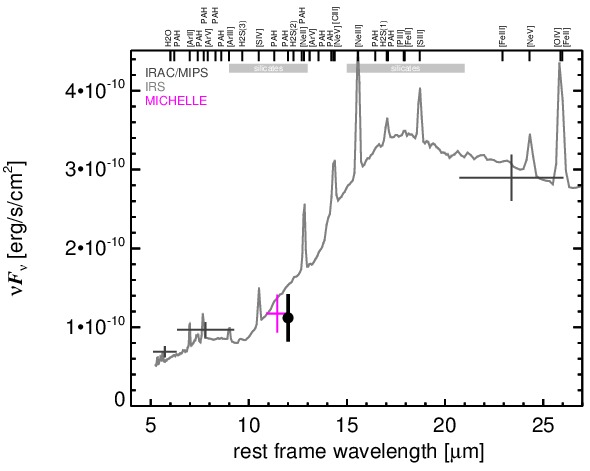
MIR SED. The description of the symbols in all the SED plots (where present) is the following: Grey crosses and solid lines mark the Spitzer/IRAC, MIPS and IRS data. The colour coding of the other symbols is as follows: green for COMICS, magenta for Michelle, blue for T-ReCS and red for VISIR data. Darker-coloured solid lines mark spectra of the corresponding instrument. The black filled circles mark the nuclear 12 and 18 micron continuum emission estimate from the data (where present). The ticks on the top axis mark positions of common MIR emission lines, while the light grey horizontal bars mark wavelength ranges affected by the silicate 10 and 18 micron features.