Sasmirala Individual Information for Mrk 573
Description
Mrk 573 is a spiral galaxy at a redshift of z = 0.0172 (D ~67.4 Mpc) with a Sy 2 nucleus [osterbrock_spectroscopic_1993] with broad emission lines in polarized light [nagao_detection_2004]. It features an extended biconical NLR coinciding with extended radio emission (diameter~ 8.9arcsec ~ 2.8 kpc; PA~ 124∘; e.g., [ulvestad_radio_1984-1, pogge_imaging_1995, schmitt_comparison_1996]). The AGN has recently also been classified as an obscured narrow-line Seyfert 1 (Sy 1n) by [ramos_almeida_unveiling_2008]. After IRAS, N-band photometry was performed with IRTF in 1985 [edelson_broad-band_1987]. No Spitzer/IRAC or MIPS images are available for Mrk 573 but a Spitzer/IRS LR staring mode spectrum, which exhibits strong forbidden emission lines, very weak silicate 10 μm absorption and PAH emission, and peaks at ~ 18 μm in νFν-space, i.e., the MIR SED seems AGN dominated. Mrk 573 was observed with T-ReCS in the N and Qa filters in 2003 [ramos_almeida_infrared_2009]. A compact MIR nucleus was detected in both images but no extension analysis could be performed because we failed to identify matching standard star observations. Therefore, we use corresponding median conversion factors for the two filters to measure the nuclear fluxes, which are consistent with [ramos_almeida_infrared_2009]. Note that our Qa flux is 37% lower but the nucleus is barely detected leading to large flux uncertainties. The N filter flux is consistent with the IRTF photometry and the Spitzer spectrophotometry, but the Qa filter flux is 53% lower. This, indicates significant cold dust contribution to the Spitzer data outside the central ~ 150 pc, even for the higher Qa value of [ramos_almeida_infrared_2009].
- [edelson_broad-band_1987] R. A. Edelson, M. A. Malkan, and G. H. Rieke. Broad-band properties of the CfA seyfert galaxies. II - infrared to millimeter properties . ApJ , 321 pp. 233–250, October 1987.
- [nagao_detection_2004] Tohru Nagao, Koji S. Kawabata, Takashi Murayama, Youichi Ohyama, Yoshiaki Taniguchi, Ryoko Sumiya, and Shunji S. Sasaki. Detection of the polarized broad emission line in the seyfert 2 galaxy markarian 573 . AJ , 128 pp. 109–114, July 2004.
- [osterbrock_spectroscopic_1993] Donald E. Osterbrock and Andre Martel. Spectroscopic study of the CfA sample of seyfert galaxies . ApJ , 414 pp. 552–562, September 1993.
- [pogge_imaging_1995] Richard W. Pogge and Michael M. De Robertis. Imaging spectrophotometry of markarian 573 . ApJ , 451 pp. 585, October 1995.
- [ramos_almeida_infrared_2009] C. Ramos Almeida, N. A. Levenson, J. M. Rodríguez Espinosa, A. Alonso-Herrero, A. Asensio Ramos, J. T. Radomski, C. Packham, R. S. Fisher, and C. M. Telesco. The infrared nuclear emission of seyfert galaxies on parsec scales: Testing the clumpy torus models . ApJ , 702 pp. 1127–1149, September 2009.
- [ramos_almeida_unveiling_2008] C. Ramos Almeida, A. M. Pérez García, J. A. Acosta-Pulido, and O. González-Martín. Unveiling the narrow-line seyfert 1 nature of markarian 573 using near-infrared spectroscopy . ApJL , 680 pp. L17–L20, June 2008.
- [schmitt_comparison_1996] Henrique R. Schmitt and Anne L. Kinney. A comparison between the narrow-line regions of seyfert 1 and seyfert 2 galaxies . ApJ , 463 pp. 498, June 1996.
- [ulvestad_radio_1984-1] J. S. Ulvestad and A. S. Wilson. Radio structures of seyfert galaxies. v - a flux-limited sample of markarian galaxies . ApJ , 278 pp. 544–557, March 1984.
Images
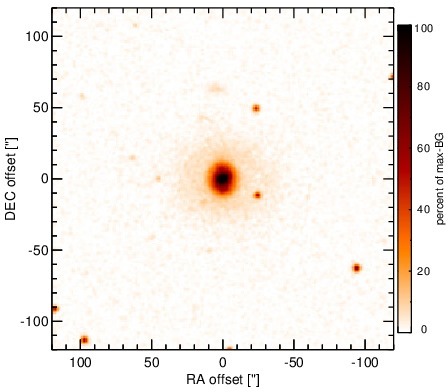
Optical image (DSS, red filter). Displayed are the central 4 arcmin with North being up and East to the left. The colour scaling is linear with white corresponding to the median background (BG) and black to the 0.01% pixels with the highest intensity.

Subarcsecond-resolution MIR images sorted by increasing filter central wavelength. Displayed are the inner 4 arcsec with North being up and East to the left. The colour scaling is logarithmic with white corresponding to median BG and black to the 75% of the highest intensity of all images in units of sig_bg. The inset image (where present; either bottom or top right) shows the central arcsecond of the PSF from the calibrator star, scaled to match the science target. The labels in the bottom left state instrument and filter names (C: COMICS, M: Michelle, T: T-ReCS, V: VISIR).
SEDs
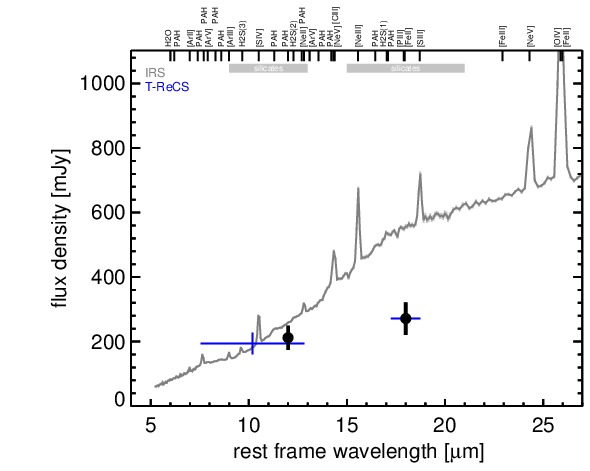
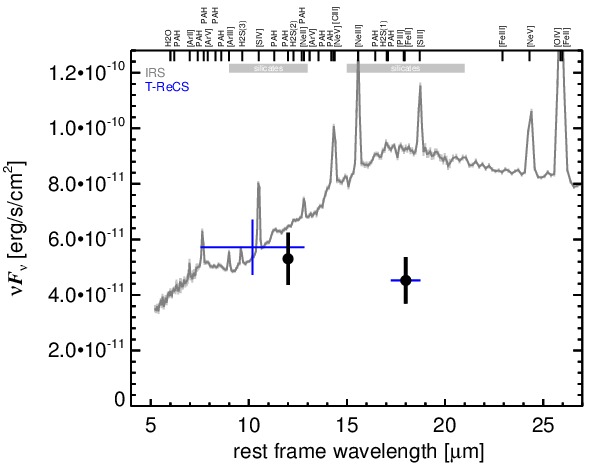
MIR SED. The description of the symbols in all the SED plots (where present) is the following: Grey crosses and solid lines mark the Spitzer/IRAC, MIPS and IRS data. The colour coding of the other symbols is as follows: green for COMICS, magenta for Michelle, blue for T-ReCS and red for VISIR data. Darker-coloured solid lines mark spectra of the corresponding instrument. The black filled circles mark the nuclear 12 and 18 micron continuum emission estimate from the data (where present). The ticks on the top axis mark positions of common MIR emission lines, while the light grey horizontal bars mark wavelength ranges affected by the silicate 10 and 18 micron features.