Sasmirala Individual Information for NGC 1068
Description
NGC 1068 is a face-on spiral-like luminous infrared galaxy at a distance 14.4 ± 3.0 Mpc (NED redshift-independent median) with an AGN optically classified either as Sy 1.8-2 [ho_search_1997-1, ho_search_1997, osterbrock_spectroscopic_1993] and has polarized broad emission lines [antonucci_spectropolarimetry_1985]. NGC 1068 is one of the original six Seyfert galaxies [seyfert_nuclear_1943] and thus its AGN is one of the most-studied at all wavelengths (see [honig_high-spatial_2008] for a recent detailed multiwavelength study), and the discovery of polarized broad emission lines in NGC 1068 led to the formulation of the unification scheme for AGN [antonucci_spectropolarimetry_1985]. It possesses a cone-like NLR in northern direction (length~ 10arcsec ~ 700 pc; PA~ 35∘; [pogge_extended_1988, evans_hst_1991]) roughly coinciding with a bended radio jet [wilson_radio_1982, gallimore_subarcsecond_1996-1], and nuclear H2O and OH maser emission perpendicularly orientated to the jet (PA~ 94∘; [claussen_water-vapor_1984, greenhill_vlbi_1996, gallimore_h_1996]). Intense circum-nuclear star formation out to radii of ~ 1 kpc was detected as well [telesco_luminous_1984, balick_footprints_1985].
NGC 1068 possesses the MIR-brightest active nucleus in terms of flux. The first MIR photometry of NGC 1068 was obtained by [kleinmann_infrared_1970]. Since then a wealth of studies employing MIR photometry and spectroscopy with bolometers, including mapping observations, were performed [kleinmann_infrared_1970, neugebauer_infrared_1971, rieke_variability_1972, rieke_infrared_1972, becklin_size_1973, jameson_infrared_1974, jameson_infrared_1974-1, stein_observations_1974, rieke_infrared_1975, kleinmann_8-13_1976, lebofsky_infrared_1978, rieke_10_1978, lebofsky_extinction_1979, telesco_extended_1980, houck_medium-resolution_1980, malkan_stellar_1983, telesco_luminous_1984, roche_8-13_1984]. NGC 1068 was also observed by all space-based MIR facilities: e.g., ISO (e.g., [rigopoulou_large_1999, lutz_iso-sws_2000, alexander_infrared_2000, le_floch_mid-infrared_2001, siebenmorgen_isocam_2004]) and Spitzer (e.g., [goulding_towards_2009]). The first ground-based N-band images were obtained by [tresch-fienberg_structure_1987] with the Goddard IR array camera mounted on IRTF, revealing an extended complex structure, which was later resolved further with the first subarcsecond resolution image obtained with an upgraded Goddard Infrared Array Camera ([braatz_high-resolution_1993]; see also [cameron_subarcsecond_1993]). Further improved MIR images with better instruments and larger telescopes followed [bock_high-resolution_1998, bock_high_2000, alloin_0.6_2000, siebenmorgen_mid-infrared_2004, gorjian_10_2004, galliano_mid-infrared_2005, poncelet_original_2007]. In addition, spectroscopic [rhee_first_2006, mason_spatially_2006, poncelet_dynamics_2008] and polarimetric [knacke_infrared_1974, aitken_infrared_1984, lumsden_near-_1999, packham_gemini_2007] studies were dedicated to the nuclear region of NGC 1068. Finally, MIR interferometric observations with MIDI were performed as well [jaffe_central_2004, poncelet_new_2006, raban_resolving_2009].
We reanalysed all the eleven conventional VISIR N- and Q-band filter images, which were obtained in 2004 [galliano_mid-infrared_2005-1], in 2005 [poncelet_dynamics_2008], and in 2008 (this work). Some of the major results of all the previous MIR studies and our own can be summarized as follows. A compact north-south elongated MIR nucleus embedded within extended emission was detected in all subarcsecond-resolution images. From the core, a thin structure extends ~ 0.5arcsec (35 pc) to the north with a PA~-7∘ before it bends to the east with a PA~ 20∘ extending another ~ 1.3arcsec (90 pc). This structure follows the radio jet along the western side and coincides with the western part of the bright ionization cone emission. In addition an emission clump is located east of this structure at a distance of ~ 0.6arcsec (42 pc; PA~ 30∘) coinciding with an eastern bright [O III] emission region. To the south, another thin structure extends with a PA~ 190∘ for ~ 1.3arcsec (90 pc). The southern structure coincides as well with [O III] emission while there is no radio counterpart. In particular in the deep VISIR 12 μm images, additional but weak emission knots can be seen at larger distances (~ 3.3arcsec ~ 230 pc) towards the north-east and south-west along the same position angles and also aligned with [O III] emission. Therefore, it seems that the non-nuclear MIR emission in general coincides with bright [O III] clouds while bracketing the radio emission. The presence of the silicate feature and MIR polarization due to dichroic emission indicates that the MIR emission is caused by dust [packham_gemini_2007]. The MIR emission line kinematics indicate that the material is outflowing along the edges of the ionization cone [poncelet_dynamics_2008]. It remains uncertain which parts of the MIR emission structure are actually associated with the obscuring torus, but most works favour that it is unresolved in the subarcsecond-resolution images as in other local AGN. Indeed, the extensive MIR interferometric observations with MIDI have found a parsec-sized structure elongated along the system axis [raban_resolving_2009]. We isolate only the unresolved nuclear component in NGC 1068 by manual PSF scaling in order to leave a roughly smooth residual. This provides fluxes much lower than the total MIR emission on arcsecond scales, e.g., on average ~ 80 lower than the Spitzer/IRS HR staring-mode spectrum. As expected our fluxes are in between the nuclear Michelle N-band spectrum of [mason_spatially_2006] (2006; dark-magenta in the figure) and the MIDI correlated flux spectrum of [raban_resolving_2009]. The nuclear photometry also indicates a deep silicate 10 μm absorption feature and a declining flux at wavelengths > 18 μm in νFν-space. This agrees with the spectroscopic studies, which found that the silicate absorption becomes stronger towards the nucleus. The complex source morphology complicates any analysis of flux variations. which is therefore omitted. In summary, we note that the nuclear MIR emission of NGC 1068 is both the brightest and most complex compared to the other local AGN on subarcsecond scales, and it is unclear, whether the results from NGC 1068 can be applied to other AGN in general.
- [aitken_infrared_1984] D. K. Aitken, G. Briggs, J. A. Bailey, P. F. Roche, and J. H. Hough. Infrared spectropolarimetry of seyfert galaxy NGC 1068 . Nature , 310 pp. 660–662, August 1984.
- [alexander_infrared_2000] Tal Alexander, Dieter Lutz, Eckhard Sturm, Reinhard Genzel, Amiel Sternberg, and Hagai Netzer. Infrared spectroscopy of NGC 1068: Probing the obscured ionizing AGN continuum . ApJ , 536 pp. 710–717, June 2000.
- [alloin_0.6_2000] D. Alloin, E. Pantin, P. O. Lagage, and G. L. Granato. 0.6 resolution images at 11 and 20 mu m of the active galactic nucleus in NGC 1068 . A&A , 363 pp. 926–932, November 2000.
- [antonucci_spectropolarimetry_1985] R. R. J. Antonucci and J. S. Miller. Spectropolarimetry and the nature of NGC 1068 . ApJ , 297 pp. 621–632, October 1985.
- [balick_footprints_1985] B. Balick and T. Heckman. Footprints of an active galactic nucleus - the nuclear zone of NGC 1068 . AJ , 90 pp. 197–203, February 1985.
- [becklin_size_1973] E. E. Becklin, K. Matthews, G. Neugebauer, and C. G. Wynn-Williams. The size of NGC 1068 AT 10 microns . ApJL , 186 pp. L69, December 1973.
- [bock_high-resolution_1998] J. J. Bock, K. A. Marsh, M. E. Ressler, and M. W. Werner. High-resolution mid-infrared imaging of the nucleus of NGC 1068 . ApJL , 504 pp. L5, September 1998.
- [bock_high_2000] J. J. Bock, G. Neugebauer, K. Matthews, B. T. Soifer, E. E. Becklin, M. Ressler, K. Marsh, M. W. Werner, E. Egami, and R. Blandford. High spatial resolution imaging of NGC 1068 in the mid-infrared . AJ , 120 pp. 2904–2919, December 2000.
- [braatz_high-resolution_1993] J. A. Braatz, A. S. Wilson, D. Y. Gezari, F. Varosi, and C. A. Beichman. High-resolution mid-infrared imaging and astrometry of the nucleus of the seyfert galaxy NGC 1068 . ApJL , 409 pp. L5–L8, May 1993.
- [cameron_subarcsecond_1993] Murray Cameron, John W. V. Storey, Valentin Rotaciuc, Reinhard Genzel, Laurent Verstraete, Siegfried Drapatz, Ralf Siebenmorgen, and Terry J. Lee. Subarcsecond mid-infrared imaging of warm dust in the narrow-line region of NGC 1068 . ApJ , 419 pp. 136, December 1993.
- [claussen_water-vapor_1984] M. J. Claussen, G. M. Heiligman, and K. Y. Lo. Water-vapor maser emission from galactic nuclei . Nature , 310 pp. 298–300, July 1984.
- [evans_hst_1991] I. N. Evans, H. C. Ford, A. L. Kinney, R. R. J. Antonucci, L. Armus, and S. Caganoff. HST imaging of the inner 3 arcseconds of NGC 1068 in the light of forbidden o III 5007 a . ApJL , 369 pp. L27–L30, March 1991.
- [galliano_mid-infrared_2005] E. Galliano, D. Alloin, E. Pantin, P. O. Lagage, and O. Marco. Mid-infrared imaging of active galaxies. active nuclei and embedded star clusters . A&A , 438 pp. 803–820, August 2005.
- [galliano_mid-infrared_2005-1] E. Galliano, E. Pantin, D. Alloin, and P. O. Lagage. Mid-infrared imaging of NGC 1068 with VISIR at the very large telescope . MNRAS , 363 pp. L1–L5, October 2005.
- [gallimore_h_1996] J. F. Gallimore, S. A. Baum, C. P. O'Dea, E. Brinks, and A. Pedlar. H 2O and OH masers as probes of the obscuring torus in NGC 1068 . ApJ , 462 pp. 740, May 1996.
- [gallimore_subarcsecond_1996-1] J. F. Gallimore, S. A. Baum, C. P. O'Dea, and A. Pedlar. The subarcsecond radio structure in NGC 1068. i. observations and results . ApJ , 458 pp. 136, February 1996.
- [gorjian_10_2004] V. Gorjian, M. W. Werner, T. H. Jarrett, D. M. Cole, and M. E. Ressler. 10 micron imaging of seyfert galaxies from the 12 micron sample . ApJ , 605 pp. 156–167, April 2004.
- [goulding_towards_2009] A. D. Goulding and D. M. Alexander. Towards a complete census of AGN in nearby galaxies: a large population of optically unidentified AGN . MNRAS , 398 pp. 1165–1193, September 2009.
- [greenhill_vlbi_1996] L. J. Greenhill, C. R. Gwinn, R. Antonucci, and R. Barvainis. VLBI imaging of water maser emission from the nuclear torus of NGC 1068 . ApJL , 472 pp. L21, November 1996.
- [ho_search_1997] Luis C. Ho, Alexei V. Filippenko, Wallace L. W. Sargent, and Chien Y. Peng. A search for ``Dwarf'' seyfert nuclei. IV. nuclei with broad h alpha emission . ApJS , 112 pp. 391, October 1997.
- [ho_search_1997-1] Luis C. Ho, Alexei V. Filippenko, and Wallace L. W. Sargent. A search for ``Dwarf'' seyfert nuclei. III. spectroscopic parameters and properties of the host galaxies . ApJS , 112 pp. 315, October 1997.
- [honig_high-spatial_2008] S. F. Hönig, M. A. Prieto, and T. Beckert. High-spatial resolution SED of NGC 1068 from near-IR to radio. disentangling the thermal and non-thermal contributions . A&A , 485 pp. 33–39, July 2008.
- [houck_medium-resolution_1980] J. R. Houck, W. J. Forrest, and J. F. McCarthy. Medium-resolution spectra of m82 and NGC 1068 from 16 to 30 microns . ApJL , 242 pp. L65–L68, December 1980.
- [jaffe_central_2004] W. Jaffe, K. Meisenheimer, H. J. A. Röttgering, Ch. Leinert, A. Richichi, O. Chesneau, D. Fraix-Burnet, A. Glazenborg-Kluttig, G.-L. Granato, U. Graser, B. Heijligers, R. Köhler, F. Malbet, G. K. Miley, F. Paresce, J.-W. Pel, G. Perrin, F. Przygodda, M. Schoeller, H. Sol, L. B. F. M. Waters, G. Weigelt, J. Woillez, and P. T. de Zeeuw. The central dusty torus in the active nucleus of NGC 1068 . Nature , 429 pp. 47–49, May 2004.
- [jameson_infrared_1974] R. F. Jameson, A. J. Longmore, J. A. McLinn, and N. J. Woolf. Infrared emission by dust in NGC 1068 and three planetary nebulae. . ApJ , 190 pp. 353–357, June 1974.
- [jameson_infrared_1974-1] R. F. Jameson, A. J. Longmore, J. A. McLinn, and N. J. Woolf. Infrared spectrum of NGC 1068 . ApJL , 187 pp. L109, February 1974.
- [kleinmann_8-13_1976] D. E. Kleinmann, F. C. Gillett, and E. L. Wright. 8-13 micron spectrophotometry of NGC 1068 . ApJ , 208 pp. 42–46, August 1976.
- [kleinmann_infrared_1970] D. E. Kleinmann and F. J. Low. Infrared observations of galaxies and of the extended nucleus in m82 . ApJL , 161 pp. L203, September 1970.
- [knacke_infrared_1974] R. F. Knacke and R. W. Capps. Infrared polarization of NGC 1068 . ApJL , 192 pp. L19, August 1974.
- [le_floch_mid-infrared_2001] E. Le Floc'h, I. F. Mirabel, O. Laurent, V. Charmandaris, P. Gallais, M. Sauvage, L. Vigroux, and C. Cesarsky. Mid-infrared observations of NGC 1068 with the infrared space observatory . A&A , 367 pp. 487–497, February 2001.
- [lebofsky_extinction_1979] M. J. Lebofsky and G. H. Rieke. Extinction in infrared-emitting galactic nuclei . ApJ , 229 pp. 111–117, April 1979.
- [lebofsky_infrared_1978] M. J. Lebofsky, J. C. Kemp, and G. H. Rieke. Infrared photometry and polarimetry of NGC 1068 . ApJ , 222 pp. 95–99, May 1978.
- [lumsden_near-_1999] S. L. Lumsden, T. J. T. Moore, C. Smith, T. Fujiyoshi, J. Bland-Hawthorn, and M. J. Ward. Near- and mid-infrared imaging polarimetry of NGC 1068 . MNRAS , 303 pp. 209–220, February 1999.
- [lutz_iso-sws_2000] D. Lutz, E. Sturm, R. Genzel, A. F. M. Moorwood, T. Alexander, H. Netzer, and A. Sternberg. ISO-SWS spectroscopy of NGC 1068 . ApJ , 536 pp. 697–709, June 2000.
- [malkan_stellar_1983] M. A. Malkan and A. V. Filippenko. The stellar and nonstellar continua of seyfert galaxies nonthermal emission in the near-infrared . ApJ , 275 pp. 477–492, December 1983.
- [mason_spatially_2006] R. E. Mason, T. R. Geballe, C. Packham, N. A. Levenson, M. Elitzur, R. S. Fisher, and E. Perlman. Spatially resolved mid-infrared spectroscopy of NGC 1068: The nature and distribution of the nuclear material . ApJ , 640 pp. 612–624, April 2006.
- [neugebauer_infrared_1971] G. Neugebauer, G. Garmire, G. H. Rieke, and F. J. Low. Infrared observations on the size of NGC 1068 . ApJL , 166 pp. L45, June 1971.
- [osterbrock_spectroscopic_1993] Donald E. Osterbrock and Andre Martel. Spectroscopic study of the CfA sample of seyfert galaxies . ApJ , 414 pp. 552–562, September 1993.
- [packham_gemini_2007] C. Packham, S. Young, S. Fisher, K. Volk, R. Mason, J. H. Hough, P. F. Roche, M. Elitzur, J. Radomski, and E. Perlman. Gemini mid-IR polarimetry of NGC 1068: Polarized structures around the nucleus . ApJL , 661 pp. L29–L32, May 2007.
- [pogge_extended_1988] Richard W. Pogge. A extended ionizing radiation cone from the nucleus of the seyfert 2 galaxy NGC 1068 . ApJ , 328 pp. 519–522, May 1988.
- [poncelet_dynamics_2008] A. Poncelet, H. Sol, and G. Perrin. Dynamics of the ionization bicone of NGC 1068 probed in mid-infrared with VISIR . A&A , 481 pp. 305–317, April 2008.
- [poncelet_new_2006] A. Poncelet, G. Perrin, and H. Sol. A new analysis of the nucleus of NGC 1068 with MIDI observations . A&A , 450 pp. 483–494, May 2006.
- [poncelet_original_2007] A. Poncelet, C. Doucet, G. Perrin, H. Sol, and P. O. Lagage. An original interferometric study of NGC 1068 with VISIR BURST mode images . A&A , 472 pp. 823–831, September 2007.
- [raban_resolving_2009] David Raban, Walter Jaffe, Huub Röttgering, Klaus Meisenheimer, and Konrad R. W. Tristram. Resolving the obscuring torus in NGC 1068 with the power of infrared interferometry: revealing the inner funnel of dust . MNRAS , 394 pp. 1325–1337, April 2009.
- [rhee_first_2006] Joseph H. Rhee and James E. Larkin. The first spatially resolved mid-infrared spectra of NGC 1068 obtained at diffraction-limited resolution with the keck i telescope long wavelength spectrometer . ApJ , 640 pp. 625–638, April 2006.
- [rieke_10_1978] G. H. Rieke and M. J. Lebofsky. 10 micron observations of bright galaxies . ApJL , 220 pp. L37–L41, March 1978.
- [rieke_infrared_1972] G. H. Rieke and F. J. Low. Infrared photometry of extragalactic sources . ApJL , 176 pp. L95, September 1972.
- [rieke_infrared_1975] G. H. Rieke and F. J. Low. The infrared spectrum of NGC 1068 . ApJL , 199 pp. L13–L17, July 1975.
- [rieke_variability_1972] G. H. Rieke and F. J. Low. Variability of extragalactic sources at 10 microns . ApJL , 177 pp. L115, November 1972.
- [rigopoulou_large_1999] D. Rigopoulou, H. W. W. Spoon, R. Genzel, D. Lutz, A. F. M. Moorwood, and Q. D. Tran. A large mid-infrared spectroscopic and near-infrared imaging survey of ultraluminous infrared galaxies: Their nature and evolution . AJ , 118 pp. 2625–2645, December 1999.
- [roche_8-13_1984] P. F. Roche, B. Whitmore, D. K. Aitken, and M. M. Phillips. 8-13 micron spectrophotometry of galaxies. II - 10 seyferts and 3C 273 . MNRAS , 207 pp. 35–45, March 1984.
- [seyfert_nuclear_1943] Carl K. Seyfert. Nuclear emission in spiral nebulae. . ApJ , 97 pp. 28, January 1943.
- [siebenmorgen_isocam_2004] R. Siebenmorgen, W. Freudling, E. Krügel, and M. Haas. ISOCAM survey and dust models of 3CR radio galaxies and quasars . A&A , 421 pp. 129–145, July 2004.
- [siebenmorgen_mid-infrared_2004] R. Siebenmorgen, E. Krügel, and H. W. W. Spoon. Mid-infrared emission of galactic nuclei. TIMMI2 versus ISO observations and models . A&A , 414 pp. 123–139, January 2004.
- [stein_observations_1974] W. A. Stein, F. C. Gillett, and K. M. Merrill. Observations of the infrared radiation from the nuclei of NGC 1068 and NGC 4151 . ApJ , 187 pp. 213–218, January 1974.
- [telesco_extended_1980] C. M. Telesco, E. E. Becklin, and C. G. Wynn-Williams. Extended 20 micron emission from the center of NGC 1068 . ApJL , 241 pp. L69–L72, October 1980.
- [telesco_luminous_1984] C. M. Telesco, E. E. Becklin, C. G. Wynn-Williams, and D. A. Harper. A luminous 3 kiloparsec infrared disk in NGC 1068 . ApJ , 282 pp. 427–435, July 1984.
- [tresch-fienberg_structure_1987] R. Tresch-Fienberg, G. G. Fazio, D. Y. Gezari, G. M. Lamb, P. K. Shu, W. F. Hoffmann, and C. R. McCreight. Structure in the nucleus of NGC 1068 at 10 microns . ApJ , 312 pp. 542–554, January 1987.
- [wilson_radio_1982] A. S. Wilson and J. S. Ulvestad. Radio structures of seyfert galaxies. III - radio and optical observations of NGC 5548 . ApJ , 260 pp. 56–64, September 1982.
Images
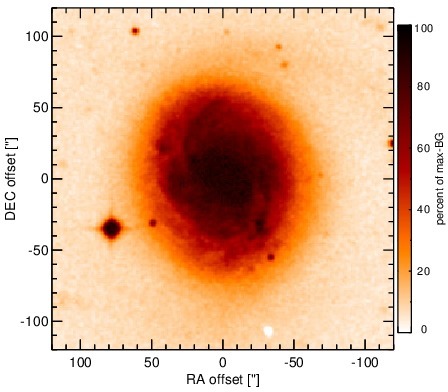
Optical image (DSS, red filter). Displayed are the central 4 arcmin with North being up and East to the left. The colour scaling is linear with white corresponding to the median background (BG) and black to the 0.01% pixels with the highest intensity.
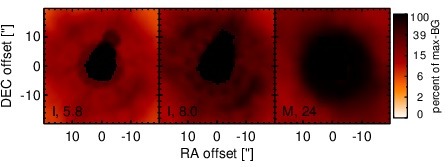
Spitzer MIR images. Displayed are the inner 40 arcsec with North being up and East to the left. The colour scaling is logarithmic with white corresponding to median BG and black to the 0.1% pixels with the highest intensity. The label in the bottom left states instrument and central wavelength of the filter in micron (I: IRAC, M: MIPS).
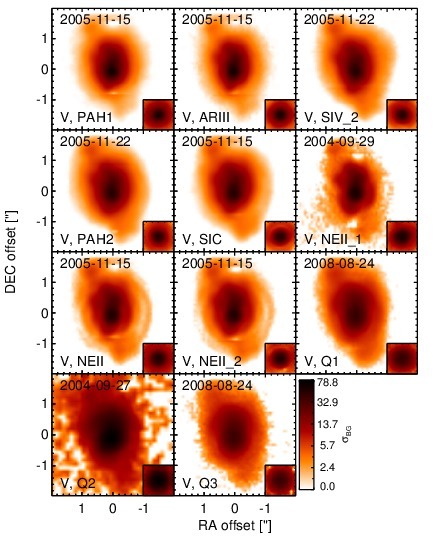
Subarcsecond-resolution MIR images sorted by increasing filter central wavelength. Displayed are the inner 4 arcsec with North being up and East to the left. The colour scaling is logarithmic with white corresponding to median BG and black to the 75% of the highest intensity of all images in units of sig_bg. The inset image (where present; either bottom or top right) shows the central arcsecond of the PSF from the calibrator star, scaled to match the science target. The labels in the bottom left state instrument and filter names (C: COMICS, M: Michelle, T: T-ReCS, V: VISIR).
SEDs
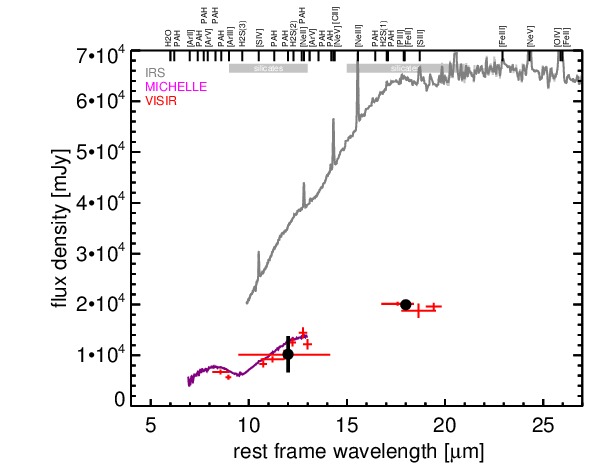
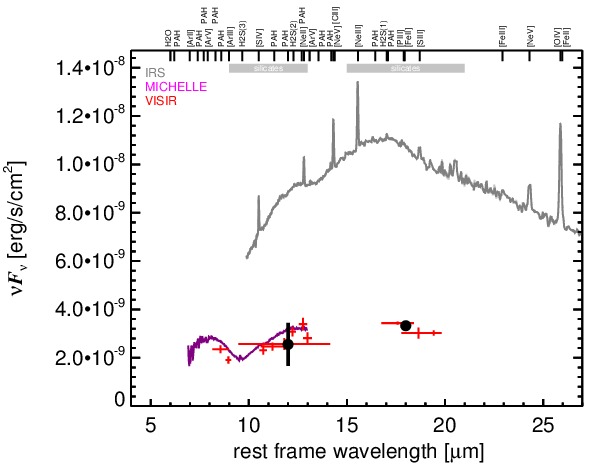
MIR SED. The description of the symbols in all the SED plots (where present) is the following: Grey crosses and solid lines mark the Spitzer/IRAC, MIPS and IRS data. The colour coding of the other symbols is as follows: green for COMICS, magenta for Michelle, blue for T-ReCS and red for VISIR data. Darker-coloured solid lines mark spectra of the corresponding instrument. The black filled circles mark the nuclear 12 and 18 micron continuum emission estimate from the data (where present). The ticks on the top axis mark positions of common MIR emission lines, while the light grey horizontal bars mark wavelength ranges affected by the silicate 10 and 18 micron features.