Sasmirala Individual Information for NGC 1144
Description
NGC 1144 is a disturbed spiral galaxy at a redshift of z = 0.0288 (D ~ 128 Mpc) interacting with the elliptical NGC 1143 (also named NGC 1141) with a nuclear separation of ~ 44arcsec ~ 26 kpc towards the north-west [hippelein_arp_1989]. It possesses a Sy 2 nucleus [veron-cetty_catalogue_2010] that belongs to the nine-month BAT AGN sample. Apart from IRAS, NGC 1142 was observed in the MIR with IRTF [edelson_broad-band_1987], with Palomar 5 m [carico_iras_1988], with ISO [charmandaris_mid-infrared_2001, ramos_almeida_mid-infrared_2007] and with Spitzer/IRAC, IRS and MIPS. In the IRAC images, a compact MIR nucleus embedded within extended complex host emission was detected. In addition, a bright compact off-nuclear source is visible ~ 9arcsec ~ 5.3 kpc away from the nucleus to the west (PA~-104∘). This region is identified as a giant H II region, labelled D in [hippelein_arp_1989]. Its brightness increases with wavelength and dominates over the nucleus in the MIPS 24 μm image. The IRS LR mapping-mode spectrum is completely star-formation dominated with strong PAH features, silicate 10 μm absorption and a red spectral slope in νFν-space (see also [wu_spitzer/irs_2009, tommasin_spitzer-irs_2010]). However, [Ne V] is also detected verifying the presence of an AGN in NGC 1144. The nucleus was observed with VISIR in eight N-band filters in 2009 (unpublished, to our knowledge) and remained undetected in four filters, in particular at short wavelengths. The other images show a weakly detected compact MIR nucleus with uncertain extension. The core of the H II region is as well weakly detected in the VISIR images but not analysed. The nuclear MIR photometry is on average ~ 47% lower than the Spitzer spectrophotometry, and in particular the PAH emission seems to be absent at subarcsecond resolution. We conclude that the AGN contributes less than half of the MIR luminosity from the central ~ 2 kpc of NGC 1144.
- [carico_iras_1988] David P. Carico, D. B. Sanders, B. T. Soifer, J. H. Elias, K. Matthews, and G. Neugebauer. The IRAS bright galaxy sample. III - 1-10 micron observations and coadded IRAS data for galaxies with l(IR) equal to or greater than 10 to the 11th solar luminosities . AJ , 95 pp. 356–373, February 1988.
- [charmandaris_mid-infrared_2001] V. Charmandaris, O. Laurent, I. F. Mirabel, P. Gallais, M. Sauvage, L. Vigroux, and C. Cesarsky. The mid-infrared view of star formation in collisional ring galaxies . Ap&SS , 276 pp. 553–559, March 2001.
- [edelson_broad-band_1987] R. A. Edelson, M. A. Malkan, and G. H. Rieke. Broad-band properties of the CfA seyfert galaxies. II - infrared to millimeter properties . ApJ , 321 pp. 233–250, October 1987.
- [hippelein_arp_1989] H. H. Hippelein. ARP 118, an interacting system with extreme velocity gradients . A&A , 216 pp. 11–18, June 1989.
- [ramos_almeida_mid-infrared_2007] C. Ramos Almeida, A. M. Pérez García, J. A. Acosta-Pulido, and J. M. Rodríguez Espinosa. The mid-infrared emission of seyfert galaxies: A new analysis of ISOCAM data . AJ , 134 pp. 2006–2019, November 2007.
- [tommasin_spitzer-irs_2010] Silvia Tommasin, Luigi Spinoglio, Matthew A. Malkan, and Giovanni Fazio. Spitzer-IRS high-resolution spectroscopy of the 12 μm seyfert galaxies. II. results for the complete data set . ApJ , 709 pp. 1257–1283, February 2010.
- [veron-cetty_catalogue_2010] M.-P. Véron-Cetty and P. Véron. A catalogue of quasars and active nuclei: 13th edition . A&A , 518 pp. 10, July 2010.
- [wu_spitzer/irs_2009] Yanling Wu, Vassilis Charmandaris, Jiasheng Huang, Luigi Spinoglio, and Silvia Tommasin. Spitzer/IRS 5-35 μm low-resolution spectroscopy of the 12 μm seyfert sample . ApJ , 701 pp. 658–676, August 2009.
Images
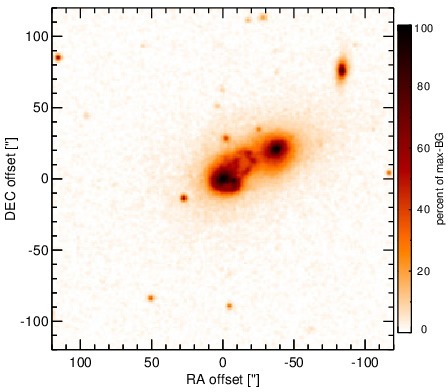
Optical image (DSS, red filter). Displayed are the central 4 arcmin with North being up and East to the left. The colour scaling is linear with white corresponding to the median background (BG) and black to the 0.01% pixels with the highest intensity.
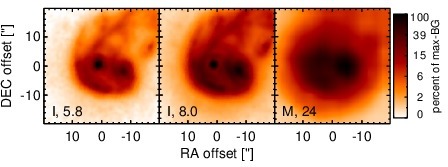
Spitzer MIR images. Displayed are the inner 40 arcsec with North being up and East to the left. The colour scaling is logarithmic with white corresponding to median BG and black to the 0.1% pixels with the highest intensity. The label in the bottom left states instrument and central wavelength of the filter in micron (I: IRAC, M: MIPS).
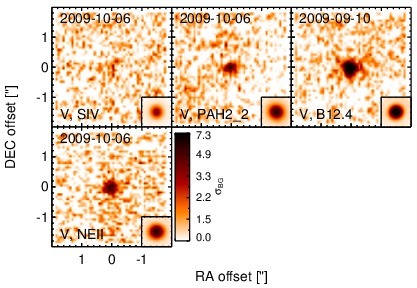
Subarcsecond-resolution MIR images sorted by increasing filter central wavelength. Displayed are the inner 4 arcsec with North being up and East to the left. The colour scaling is logarithmic with white corresponding to median BG and black to the 75% of the highest intensity of all images in units of sig_bg. The inset image (where present; either bottom or top right) shows the central arcsecond of the PSF from the calibrator star, scaled to match the science target. The labels in the bottom left state instrument and filter names (C: COMICS, M: Michelle, T: T-ReCS, V: VISIR).
SEDs
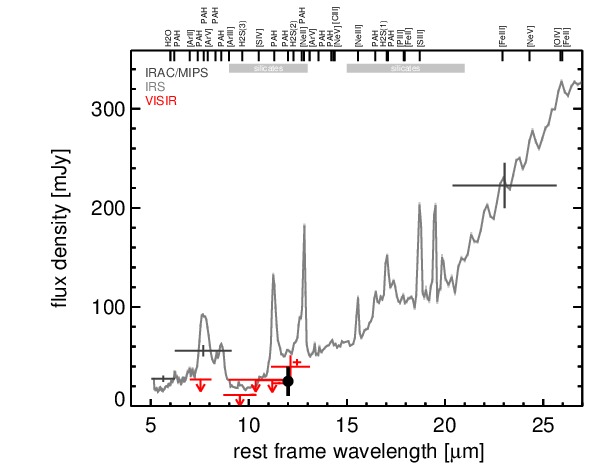
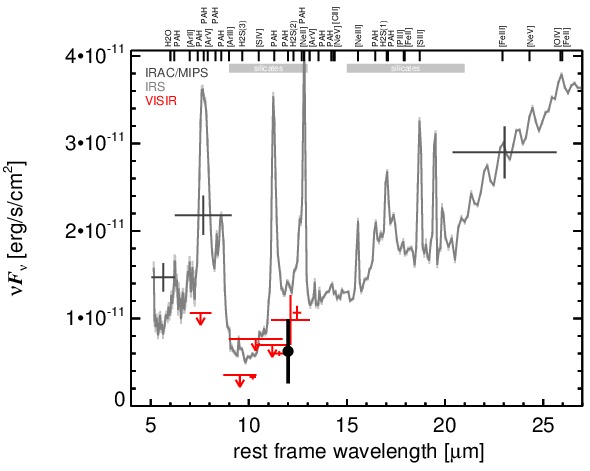
MIR SED. The description of the symbols in all the SED plots (where present) is the following: Grey crosses and solid lines mark the Spitzer/IRAC, MIPS and IRS data. The colour coding of the other symbols is as follows: green for COMICS, magenta for Michelle, blue for T-ReCS and red for VISIR data. Darker-coloured solid lines mark spectra of the corresponding instrument. The black filled circles mark the nuclear 12 and 18 micron continuum emission estimate from the data (where present). The ticks on the top axis mark positions of common MIR emission lines, while the light grey horizontal bars mark wavelength ranges affected by the silicate 10 and 18 micron features.