Sasmirala Individual Information for NGC 1365
Description
NGC 1365 is an infrared-luminous low-inclination barred spiral galaxy at a distance of D = 17.9 ± 2.7 Mpc (NED redshift-independent median) with an AGN and intense circum-nuclear star formation (see [lindblad_ngc_1999] for a global review, and [alonso-herrero_probing_2012] for a dedicated infrared study of the nuclear region). The AGN has been classified optically either as Sy 1.5 [schulz_clues_1999], Sy 1.8 [edmunds_nuclear_1982] or as Sy 1.9/H II [trippe_multi-wavelength_2010]. At radio wavelengths, the most prominent feature is the kiloparsec-scale star formation ring (8arcsec × 20arcsec; PA~ 30∘, [sandqvist_radio_1982]), which contains numerous bright super star clusters [kristen_imaging_1997, galliano_mid-infrared_2005]. The nucleus is only a faint radio source with a possible jet emanating ~ 5arcsec ~ 440 pc towards the south-east with a PA~ 125∘ [sandqvist_central_1995]. This jet coincides with the one-side cone-like outflowing [O III] emission [phillips_remarkable_1983, jorsater_kinematics_1984, storchi-bergmann_detection_1991, kristen_imaging_1997]. At X-ray wavelengths, the nucleus is highly variable with dramatic changes in obscuration, which suggests that X-ray absorption originates from the BLR clouds [risaliti_hard_2000-1, risaliti_rapid_2005, risaliti_xmm-newton_2009]. NGC 1365 also belongs to the nine-month BAT AGN sample. The first N-band photometric and spectrophotometric observations of NGC 1365 were carried by [frogel_8-13_1982] [roche_8-13_1984] and [devereux_spatial_1987]. After the IRAS images, [telesco_genesis_1993] obtained an N-band map with the NASA MSFC bolometer array at the IRTF, which showed the extended complex MIR morphology with the bright off-nuclear super clusters as one blended source. NGC 1365 was also observed with ISO [roussel_atlas_2001, forster_schreiber_warm_2004] but the nuclear region is not sufficiently resolved to isolate the AGN. The first subarcsecond resolution N-band images of the nuclear region were obtained with CTIO 4 m/OSCIR in 1998 [ramos_almeida_infrared_2009], and in 2001 and 2002 with ESO 3.6 m/TIMMI2 [siebenmorgen_mid-infrared_2004, galliano_mid-infrared_2005, raban_core_2008]. Three particularly bright compact MIR sources inside the starburst ring ~ 9arcsec ~ 780 pc north-west of the nucleus were detected. The nucleus itself appeared slightly elongated along the east-west direction. Despite lower angular resolution, the same morphology is visible in the Spitzer/IRAC and MIPS images. The nucleus becomes fainter compared to the star formation with increasing wavelengths (see also [alonso-herrero_probing_2012]). The PBCD IRAC 8.0 μm image is partly saturated and not used (see [gallimore_infrared_2010]), while our IRAC 5.8 μm flux measurements of the nuclear component is significantly lower than the value published in [gallimore_infrared_2010]. The IRS LR staring-mode spectrum is star-formation dominated with prominent PAH features, possibly silicate 10 μm absorption and a red spectral slope in νFν-space, although also the AGN-indicative [Ne V] was detected (see also [buchanan_spitzer_2006, brandl_mid-infrared_2006, dudik_mid-infrared_2007, wu_spitzer/irs_2009, bernard-salas_spitzer_2009, tommasin_spitzer-irs_2010, gallimore_infrared_2010, alonso-herrero_probing_2012]). The nuclear region of NGC 1365 was observed with VISIR in the NEII filter in 2004 [galliano_extremely_2008] and in three additional narrow N-band filters in 2009 (this work). We focus only on the nucleus and refer to [galliano_extremely_2008] for a detailed analysis of the non-nuclear emission as seen by VISIR. In addition, a T-ReCS LR N-band spectrum was obtained [gonzalez-martin_dust_2013], as well as Si2 and Qa images, which were still not publically available at the time of writing [alonso-herrero_probing_2012]. In all the VISIR images, a slightly elongated MIR nucleus but with inconsistent position angles was detected. Therefore, we classify its MIR extension as uncertain. Our nuclear VISIR photometry is on average ~ 58% lower than the Spitzer spectrophotometry, lower than the TIMMI2 photometry, consistent with the OSCIR photometry, and ~ 25% higher than the PSF-extracted T-ReCS spectrum. This indicates, the nucleus is indeed slightly extended in the VISIR images. Interestingly, the T-ReCS spectrum is basically free of any spectral features (similar to the TIMMI2 spectrum by [siebenmorgen_mid-infrared_2004]). Thus, it most likely traces uncontaminated AGN emission, and we use the T-ReCS spectrum for the 12 μm continuum emission estimate. We conclude that star formation dominates the MIR emission in the central 350 pc of NGC 1365. Note that the MIR nucleus appears slightly resolved and elongated with a size \⪅2 pc in the MIR interferometric MIDI observations described by [tristram_parsec-scale_2009] and [burtscher_diversity_2013].
- [alonso-herrero_probing_2012] A. Alonso-Herrero, M. Sánchez-Portal, C. Ramos Almeida, M. Pereira-Santaella, P. Esquej, S. García-Burillo, M. Castillo, O. González-Martín, N. Levenson, E. Hatziminaoglou, J. A. Acosta-Pulido, J. I. González-Serrano, M. Pović, C. Packham, and A. M. Pérez-García. Probing the nuclear and circumnuclear activity of NGC 1365 in the infrared . MNRAS , 425 pp. 311–324, September 2012.
- [bernard-salas_spitzer_2009] J. Bernard-Salas, H. W. W. Spoon, V. Charmandaris, V. Lebouteiller, D. Farrah, D. Devost, B. R. Brandl, Yanling Wu, L. Armus, L. Hao, G. C. Sloan, D. Weedman, and J. R. Houck. A spitzer high-resolution mid-infrared spectral atlas of starburst galaxies . ApJS , 184 pp. 230–247, October 2009.
- [brandl_mid-infrared_2006] B. R. Brandl, J. Bernard-Salas, H. W. W. Spoon, D. Devost, G. C. Sloan, S. Guilles, Y. Wu, J. R. Houck, D. W. Weedman, L. Armus, P. N. Appleton, B. T. Soifer, V. Charmandaris, L. Hao, J. A. Marshall Higdon, and T. L. Herter. The mid-infrared properties of starburst galaxies from spitzer-IRS spectroscopy . ApJ , 653 pp. 1129–1144, December 2006.
- [buchanan_spitzer_2006] Catherine L. Buchanan, Jack F. Gallimore, Christopher P. O'Dea, Stefi A. Baum, David J. Axon, Andrew Robinson, Moshe Elitzur, and Martin Elvis. Spitzer IRS spectra of a large sample of seyfert galaxies: A variety of infrared spectral energy distributions in the local active galactic nucleus population . AJ , 132 pp. 401–419, July 2006.
- [burtscher_diversity_2013] L. Burtscher, K. Meisenheimer, K. R. W. Tristram, W. Jaffe, S. F. Hönig, R. I. Davies, M. Kishimoto, J.-U. Pott, H. Röttgering, M. Schartmann, G. Weigelt, and S. Wolf. A diversity of dusty AGN tori. data release for the VLTI/MIDI AGN large program and first results for 23 galaxies . A&A , 558 pp. 149, October 2013.
- [devereux_spatial_1987] Nicholas Devereux. The spatial distribution of 10 micron luminosity in spiral galaxies . ApJ , 323 pp. 91–107, December 1987.
- [dudik_mid-infrared_2007] R. P. Dudik, J. C. Weingartner, S. Satyapal, Jacqueline Fischer, C. C. Dudley, and B. O'Halloran. Mid-infrared fine-structure line ratios in active galactic nuclei observed with the spitzer IRS: evidence for extinction by the torus . ApJ , 664 pp. 71–87, July 2007.
- [edmunds_nuclear_1982] M. G. Edmunds and B. E. J. Pagel. On the nuclear spectrum of NGC 1365 . MNRAS , 198 pp. 1089–1107, March 1982.
- [forster_schreiber_warm_2004] N. M. Förster Schreiber, H. Roussel, M. Sauvage, and V. Charmandaris. Warm dust and aromatic bands as quantitative probes of star-formation activity . A&A , 419 pp. 501–516, May 2004.
- [frogel_8-13_1982] J. F. Frogel, J. H. Elias, and M. M. Phillips. 8-13 micron observations of nine emission-line galaxies . ApJ , 260 pp. 70–74, September 1982.
- [galliano_extremely_2008] E. Galliano, D. Alloin, E. Pantin, G. L. Granato, P. Delva, L. Silva, P. O. Lagage, and P. Panuzzo. Extremely massive young clusters in NGC 1365 . A&A , 492 pp. 3–22, December 2008.
- [galliano_mid-infrared_2005] E. Galliano, D. Alloin, E. Pantin, P. O. Lagage, and O. Marco. Mid-infrared imaging of active galaxies. active nuclei and embedded star clusters . A&A , 438 pp. 803–820, August 2005.
- [gallimore_infrared_2010] J. F. Gallimore, A. Yzaguirre, J. Jakoboski, M. J. Stevenosky, D. J. Axon, S. A. Baum, C. L. Buchanan, M. Elitzur, M. Elvis, C. P. O'Dea, and A. Robinson. Infrared spectral energy distributions of seyfert galaxies: Spitzer space telescope observations of the 12 μm sample of active galaxies . ApJS , 187 pp. 172–211, March 2010.
- [gonzalez-martin_dust_2013] O. González-Martín, J. M. Rodríguez-Espinosa, T. Díaz-Santos, C. Packham, A. Alonso-Herrero, P. Esquej, C. Ramos Almeida, R. Mason, and C. Telesco. Dust in active galactic nuclei. mid-infrared t-ReCS/Gemini spectra using the new RedCan pipeline . A&A , 553 pp. 35, May 2013.
- [jorsater_kinematics_1984] S. Jorsater, P. O. Lindblad, and A. Boksenberg. The kinematics of the hot gas in the nuclear region of NGC 1365 . A&A , 140 pp. 288–294, November 1984.
- [kristen_imaging_1997] Helmuth Kristen, Steven Jorsater, Per Olof Lindblad, and Alec Boksenberg. Imaging the nuclear environment of NGC 1365 with the hubble space telescope . A&A , 328 pp. 483–492, December 1997.
- [lindblad_ngc_1999] Per Olof Lindblad. NGC 1365 . A&ARv , 9 pp. 221–271, 1999.
- [phillips_remarkable_1983] M. M. Phillips, M. G. Edmunds, B. E. J. Pagel, and A. J. Turtle. Remarkable kinematics of the ionized gas in the nucleus of NGC 1365 . MNRAS , 203 pp. 759–765, May 1983.
- [raban_core_2008] D. Raban, B. Heijligers, H. Röttgering, K. Meisenheimer, W. Jaffe, H. U. Käufl, and T. Henning. The core flux of the brightest 10 μm galaxies in the southern sky . A&A , 484 pp. 341–345, June 2008.
- [ramos_almeida_infrared_2009] C. Ramos Almeida, N. A. Levenson, J. M. Rodríguez Espinosa, A. Alonso-Herrero, A. Asensio Ramos, J. T. Radomski, C. Packham, R. S. Fisher, and C. M. Telesco. The infrared nuclear emission of seyfert galaxies on parsec scales: Testing the clumpy torus models . ApJ , 702 pp. 1127–1149, September 2009.
- [risaliti_hard_2000-1] G. Risaliti, R. Gilli, R. Maiolino, and M. Salvati. The hard x-ray emission of luminous infrared galaxies . A&A , 357 pp. 13–23, May 2000.
- [risaliti_rapid_2005] G. Risaliti, M. Elvis, G. Fabbiano, A. Baldi, and A. Zezas. Rapid compton-thick/Compton-thin transitions in the seyfert 2 galaxy NGC 1365 . ApJ , 623 pp. L93–L96, April 2005.
- [risaliti_xmm-newton_2009] G. Risaliti, M. Salvati, M. Elvis, G. Fabbiano, A. Baldi, S. Bianchi, V. Braito, M. Guainazzi, G. Matt, G. Miniutti, J. Reeves, R. Soria, and A. Zezas. The XMM-Newton long look of NGC 1365: uncovering of the obscured x-ray source . MNRAS , 393 pp. L1–L5, February 2009.
- [roche_8-13_1984] P. F. Roche, B. Whitmore, D. K. Aitken, and M. M. Phillips. 8-13 micron spectrophotometry of galaxies. II - 10 seyferts and 3C 273 . MNRAS , 207 pp. 35–45, March 1984.
- [roussel_atlas_2001] H. Roussel, L. Vigroux, A. Bosma, M. Sauvage, C. Bonoli, P. Gallais, T. Hawarden, J. Lequeux, S. Madden, and P. Mazzei. An atlas of mid-infrared dust emission in spiral galaxies . A&A , 369 pp. 473–509, April 2001.
- [sandqvist_central_1995] A. Sandqvist, S. Joersaeter, and P. O. Lindblad. The central region of NGC 1365. VLA and SEST observations of the radio continuum and CO. . A&A , 295 pp. 585, March 1995.
- [sandqvist_radio_1982] A. Sandqvist, S. Jorsater, and P. O. Lindblad. The radio structure of the nuclear region of NGC 1365 . A&A , 110 pp. 336–344, June 1982.
- [schulz_clues_1999] Hartmut Schulz, Stefanie Komossa, Clemens Schmitz, and Anita Mücke. Clues on the obscured active nucleus of NGC 1365 . A&A , 346 pp. 764–768, June 1999.
- [siebenmorgen_mid-infrared_2004] R. Siebenmorgen, E. Krügel, and H. W. W. Spoon. Mid-infrared emission of galactic nuclei. TIMMI2 versus ISO observations and models . A&A , 414 pp. 123–139, January 2004.
- [storchi-bergmann_detection_1991] Thaisa Storchi-Bergmann and Charles J. Bonatto. Detection of a forbidden o III 5007-a radiation cone in the nuclei of NGC 1365 and 7582 . MNRAS , 250 pp. 138–143, May 1991.
- [telesco_genesis_1993] C. M. Telesco, L. L. Dressel, and R. D. Wolstencroft. The genesis of starbursts and infrared emission in the centers of galaxies . ApJ , 414 pp. 120–143, September 1993.
- [tommasin_spitzer-irs_2010] Silvia Tommasin, Luigi Spinoglio, Matthew A. Malkan, and Giovanni Fazio. Spitzer-IRS high-resolution spectroscopy of the 12 μm seyfert galaxies. II. results for the complete data set . ApJ , 709 pp. 1257–1283, February 2010.
- [trippe_multi-wavelength_2010] M. L. Trippe, D. M. Crenshaw, R. P. Deo, M. Dietrich, S. B. Kraemer, S. E. Rafter, and T. J. Turner. A multi-wavelength study of the nature of type 1.8/1.9 seyfert galaxies . ApJ , 725 pp. 1749–1767, December 2010.
- [tristram_parsec-scale_2009] K. R. W. Tristram, D. Raban, K. Meisenheimer, W. Jaffe, H. Röttgering, L. Burtscher, W. D. Cotton, U. Graser, Th. Henning, Ch. Leinert, B. Lopez, S. Morel, G. Perrin, and M. Wittkowski. Parsec-scale dust distributions in seyfert galaxies. results of the MIDI AGN snapshot survey . A&A , 502 pp. 67–84, July 2009.
- [wu_spitzer/irs_2009] Yanling Wu, Vassilis Charmandaris, Jiasheng Huang, Luigi Spinoglio, and Silvia Tommasin. Spitzer/IRS 5-35 μm low-resolution spectroscopy of the 12 μm seyfert sample . ApJ , 701 pp. 658–676, August 2009.
Images
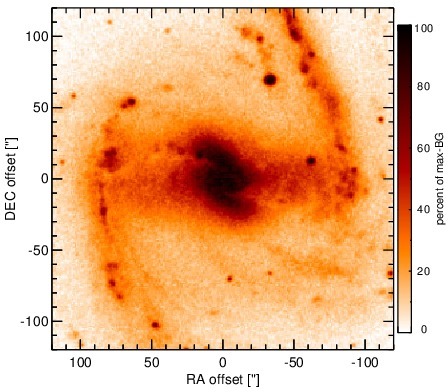
Optical image (DSS, red filter). Displayed are the central 4 arcmin with North being up and East to the left. The colour scaling is linear with white corresponding to the median background (BG) and black to the 0.01% pixels with the highest intensity.
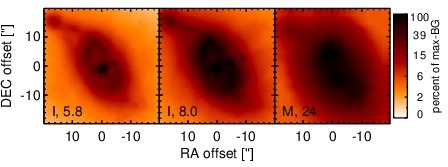
Spitzer MIR images. Displayed are the inner 40 arcsec with North being up and East to the left. The colour scaling is logarithmic with white corresponding to median BG and black to the 0.1% pixels with the highest intensity. The label in the bottom left states instrument and central wavelength of the filter in micron (I: IRAC, M: MIPS).
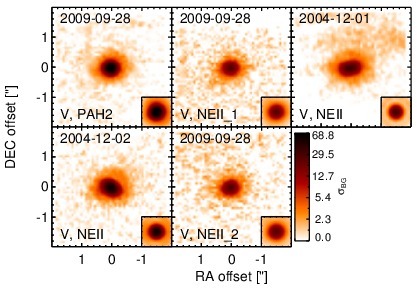
Subarcsecond-resolution MIR images sorted by increasing filter central wavelength. Displayed are the inner 4 arcsec with North being up and East to the left. The colour scaling is logarithmic with white corresponding to median BG and black to the 75% of the highest intensity of all images in units of sig_bg. The inset image (where present; either bottom or top right) shows the central arcsecond of the PSF from the calibrator star, scaled to match the science target. The labels in the bottom left state instrument and filter names (C: COMICS, M: Michelle, T: T-ReCS, V: VISIR).
SEDs
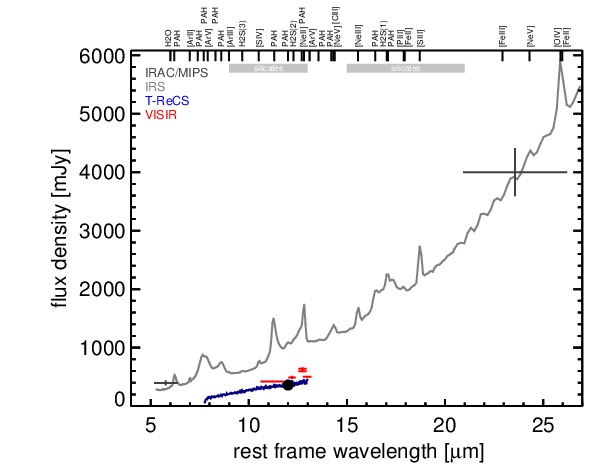
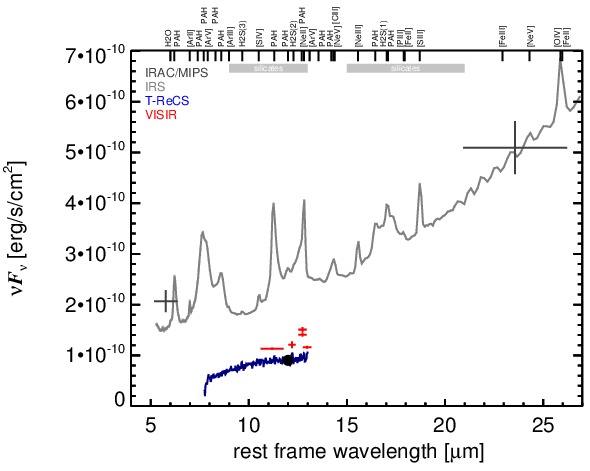
MIR SED. The description of the symbols in all the SED plots (where present) is the following: Grey crosses and solid lines mark the Spitzer/IRAC, MIPS and IRS data. The colour coding of the other symbols is as follows: green for COMICS, magenta for Michelle, blue for T-ReCS and red for VISIR data. Darker-coloured solid lines mark spectra of the corresponding instrument. The black filled circles mark the nuclear 12 and 18 micron continuum emission estimate from the data (where present). The ticks on the top axis mark positions of common MIR emission lines, while the light grey horizontal bars mark wavelength ranges affected by the silicate 10 and 18 micron features.