Sasmirala Individual Information for NGC 1386
Description
NGC 1386 is an edge-on spiral galaxy in the Fornax cluster at a distance of D = 16.5 ± 0.8 Mpc (NED redshift independent median) with a Sy 2 nucleus with broad lines in the near-infrared [reunanen_near-infrared_2002] that belongs to the nine-month BAT AGN sample. The nuclear radio source is slightly extended to the south (PA~ 170∘; [nagar_radio_1999]), and is surrounded by a biconical north-south extended NLR, which has been extensively studied (major axis~ 6arcsec ~ 480 pc; PA~ 5∘; e.g., [weaver_kinematics_1991, ferruit_hubble_2000, schmitt_hubble_2003, bennert_size_2006-1]). In addition, a nuclear H2O mega-maser was detected [braatz_survey_1996, braatz_survey_1997]. The first MIR observations of NGC 1386 were performed by [phillips_infrared_1980], followed by [sparks_infrared_1986] and [devereux_spatial_1987]. Later, NGC 1386 was also observed with ISO [clavel_2.5-11_2000, ramos_almeida_mid-infrared_2007] and ESO 3.6 m/TIMMI2 [siebenmorgen_mid-infrared_2004]. The MIR nucleus appeared slightly resolved in the TIMMI2 image. The Spitzer/IRAC, IRS and MIPS images, the MIR nucleus appears nearly unresolved except in the IRAC 8.0 μm image, where the nucleus is slightly elongated along the north-south direction. In addition, faint spiral-like host emission is visible in the IRAC images. Our IRAC 5.8 and 8.0 μm nuclear photometry is ~ 25% lower than the values by [gallimore_infrared_2010] but in rough agreement with the Spitzer/IRS LR staring mode spectrum, while the MIPS 24 μm agrees with the value by [temi_spitzer_2009]. The IRS spectrum is dominated by the deep silicate 10 μm and a moderate silicate 18 μm absorption features in addition to PAH emission, prominent forbidden emission lines and a shallow spectral slope in νFν-space (see also [shi_9.7_2006, wu_spitzer/irs_2009, deo_mid-infrared_2009, tommasin_spitzer-irs_2010, gallimore_infrared_2010]). NGC 1386 was imaged with T-ReCS in the broad N and Q filters in 2003 [ramos_almeida_infrared_2009], and an LR N-band spectrum was presented in [gonzalez-martin_dust_2013]. and with VISIR in PAH2_2 and Q2 in 2006 [reunanen_vlt_2010] as well as in PAH1 and SIV_2 in 2010 (this work). In all but the latest two VISIR images, a ~ 1arcsec (80 pc) north-south extended nucleus is visible (PA~ 0∘). The reason why this extended feature is not visible in the PAH1 and SIV_2 images is presumably the bad MIR seeing during these observations. On the other hand, it is possible that it is intrinsically weaker at shorter wavelengths. The extended emission is aligned with the NLR and thus presumably originates from hot optically thin dust in the NLR as already suggested by [bennert_size_2006-1]. We perform manual PSF-scaling to determine only the unresolved nuclear flux in the VISIR images and obtain values consistent with [reunanen_vlt_2010], while no matching standard star could be retrieved for the T-ReCS images. Therefore, we treat the T-ReCS measurements as upper limits. The resulting VISIR nuclear photometry is on average ~ 50% lower than the Spitzer spectrophotometry and agrees with the T-ReCS spectrum, which exhibits the same silicate 10μm absorption but no PAH emission compared to the IRS spectrum. Therefore, we use the T-ReCS spectrum to estimate the nuclear 12 μm continuum emission corrected for the silicate feature. The subarcsecond-resolution Q-band in relation to the N-band values indicate that the silicate 18 μm absorption has at least the same strength as in the IRS spectrum at subarcsecond resolution. We conclude that the nuclear obscuring structure contributes less than half of the MIR emission in the central 300 pc of NGC 1386, while the other part is caused by a dusty NLR and star formation.
- [bennert_size_2006-1] N. Bennert, B. Jungwiert, S. Komossa, M. Haas, and R. Chini. Size and properties of the narrow-line region in seyfert-1 galaxies from spatially-resolved optical spectroscopy . A&A , 459 pp. 55–69, November 2006.
- [braatz_survey_1996] J. A. Braatz, A. S. Wilson, and C. Henkel. A survey for h 2O megamasers in active galactic nuclei. i. observations . ApJS , 106 pp. 51, September 1996.
- [braatz_survey_1997] J. A. Braatz, A. S. Wilson, and C. Henkel. A survey for h 2O megamasers in active galactic nuclei. II. a comparison of detected and undetected galaxies . ApJS , 110 pp. 321, June 1997.
- [clavel_2.5-11_2000] J. Clavel, B. Schulz, B. Altieri, P. Barr, P. Claes, A. Heras, K. Leech, L. Metcalfe, and A. Salama. 2.5-11 micron spectroscopy and imaging of AGNs. implication for unification schemes . A&A , 357 pp. 839–849, May 2000.
- [deo_mid-infrared_2009] Rajesh P. Deo, Gordon T. Richards, D. M. Crenshaw, and S. B. Kraemer. The mid-infrared continua of seyfert galaxies . ApJ , 705 pp. 14–31, November 2009.
- [devereux_spatial_1987] Nicholas Devereux. The spatial distribution of 10 micron luminosity in spiral galaxies . ApJ , 323 pp. 91–107, December 1987.
- [ferruit_hubble_2000] Pierre Ferruit, Andrew S. Wilson, and John Mulchaey. Hubble space telescope WFPC2 imaging of a sample of early-type seyfert galaxies . ApJS , 128 pp. 139–169, May 2000.
- [gallimore_infrared_2010] J. F. Gallimore, A. Yzaguirre, J. Jakoboski, M. J. Stevenosky, D. J. Axon, S. A. Baum, C. L. Buchanan, M. Elitzur, M. Elvis, C. P. O'Dea, and A. Robinson. Infrared spectral energy distributions of seyfert galaxies: Spitzer space telescope observations of the 12 μm sample of active galaxies . ApJS , 187 pp. 172–211, March 2010.
- [gonzalez-martin_dust_2013] O. González-Martín, J. M. Rodríguez-Espinosa, T. Díaz-Santos, C. Packham, A. Alonso-Herrero, P. Esquej, C. Ramos Almeida, R. Mason, and C. Telesco. Dust in active galactic nuclei. mid-infrared t-ReCS/Gemini spectra using the new RedCan pipeline . A&A , 553 pp. 35, May 2013.
- [nagar_radio_1999] Neil M. Nagar, Andrew S. Wilson, John S. Mulchaey, and Jack F. Gallimore. Radio structures of seyfert galaxies. VIII. a distance- and magnitude-limited sample of early-type galaxies . ApJS , 120 pp. 209–245, February 1999.
- [phillips_infrared_1980] M. M. Phillips and J. A. Frogel. Infrared and optical properties of the emission-line galaxies NGC 1386 and NGC 1365 . ApJ , 235 pp. 761–768, February 1980.
- [ramos_almeida_infrared_2009] C. Ramos Almeida, N. A. Levenson, J. M. Rodríguez Espinosa, A. Alonso-Herrero, A. Asensio Ramos, J. T. Radomski, C. Packham, R. S. Fisher, and C. M. Telesco. The infrared nuclear emission of seyfert galaxies on parsec scales: Testing the clumpy torus models . ApJ , 702 pp. 1127–1149, September 2009.
- [ramos_almeida_mid-infrared_2007] C. Ramos Almeida, A. M. Pérez García, J. A. Acosta-Pulido, and J. M. Rodríguez Espinosa. The mid-infrared emission of seyfert galaxies: A new analysis of ISOCAM data . AJ , 134 pp. 2006–2019, November 2007.
- [reunanen_near-infrared_2002] J. Reunanen, J. K. Kotilainen, and M. A. Prieto. Near-infrared spectroscopy of nearby seyfert galaxies - i. first results . MNRAS , 331 pp. 154–168, March 2002.
- [reunanen_vlt_2010] J. Reunanen, M. A. Prieto, and R. Siebenmorgen. VLT diffraction-limited imaging at 11 and 18μm of the nearest active galactic nuclei . MNRAS , 402 pp. 879–894, February 2010.
- [schmitt_hubble_2003] H. R. Schmitt, J. L. Donley, R. R. J. Antonucci, J. B. Hutchings, and A. L. Kinney. A hubble space telescope survey of extended [o III] λ5007 emission in a far-infrared selected sample of seyfert galaxies: Observations . ApJS , 148 pp. 327–352, October 2003.
- [shi_9.7_2006] Y. Shi, G. H. Rieke, D. C. Hines, V. Gorjian, M. W. Werner, K. Cleary, F. J. Low, P. S. Smith, and J. Bouwman. 9.7 μm silicate features in active galactic nuclei: New insights into unification models . ApJ , 653 pp. 127–136, December 2006.
- [siebenmorgen_mid-infrared_2004] R. Siebenmorgen, E. Krügel, and H. W. W. Spoon. Mid-infrared emission of galactic nuclei. TIMMI2 versus ISO observations and models . A&A , 414 pp. 123–139, January 2004.
- [sparks_infrared_1986] W. B. Sparks, J. H. Hough, D. J. Axon, and J. Bailey. Infrared photometry of the nuclei of early-type radio galaxies . MNRAS , 218 pp. 429–444, February 1986.
- [temi_spitzer_2009] Pasquale Temi, Fabrizio Brighenti, and William G. Mathews. Spitzer observations of passive and star-forming early-type galaxies: An infrared color-color sequence . ApJ , 707 pp. 890–902, December 2009.
- [tommasin_spitzer-irs_2010] Silvia Tommasin, Luigi Spinoglio, Matthew A. Malkan, and Giovanni Fazio. Spitzer-IRS high-resolution spectroscopy of the 12 μm seyfert galaxies. II. results for the complete data set . ApJ , 709 pp. 1257–1283, February 2010.
- [weaver_kinematics_1991] K. A. Weaver, A. S. Wilson, and J. A. Baldwin. Kinematics and ionization of extended gas in active galaxies. VI - the seyfert 2 galaxy NGC 1386 . ApJ , 366 pp. 50–63, January 1991.
- [wu_spitzer/irs_2009] Yanling Wu, Vassilis Charmandaris, Jiasheng Huang, Luigi Spinoglio, and Silvia Tommasin. Spitzer/IRS 5-35 μm low-resolution spectroscopy of the 12 μm seyfert sample . ApJ , 701 pp. 658–676, August 2009.
Images
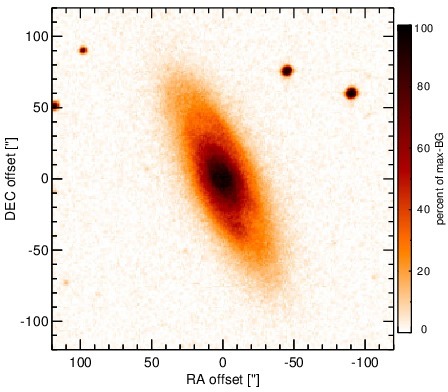
Optical image (DSS, red filter). Displayed are the central 4 arcmin with North being up and East to the left. The colour scaling is linear with white corresponding to the median background (BG) and black to the 0.01% pixels with the highest intensity.
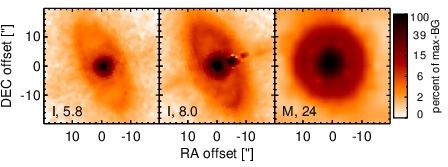
Spitzer MIR images. Displayed are the inner 40 arcsec with North being up and East to the left. The colour scaling is logarithmic with white corresponding to median BG and black to the 0.1% pixels with the highest intensity. The label in the bottom left states instrument and central wavelength of the filter in micron (I: IRAC, M: MIPS).
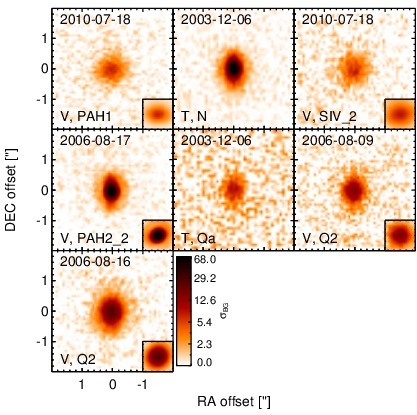
Subarcsecond-resolution MIR images sorted by increasing filter central wavelength. Displayed are the inner 4 arcsec with North being up and East to the left. The colour scaling is logarithmic with white corresponding to median BG and black to the 75% of the highest intensity of all images in units of sig_bg. The inset image (where present; either bottom or top right) shows the central arcsecond of the PSF from the calibrator star, scaled to match the science target. The labels in the bottom left state instrument and filter names (C: COMICS, M: Michelle, T: T-ReCS, V: VISIR).
SEDs
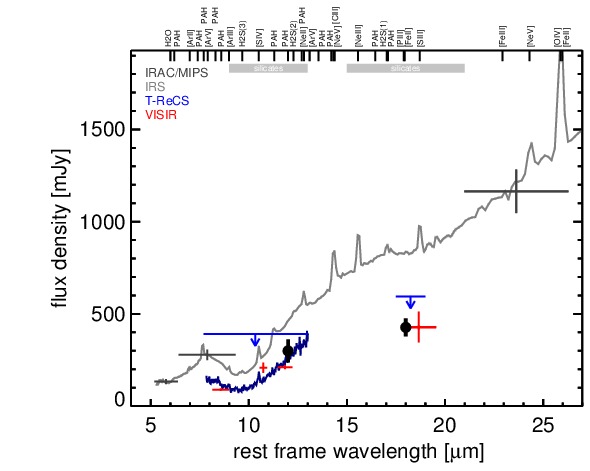
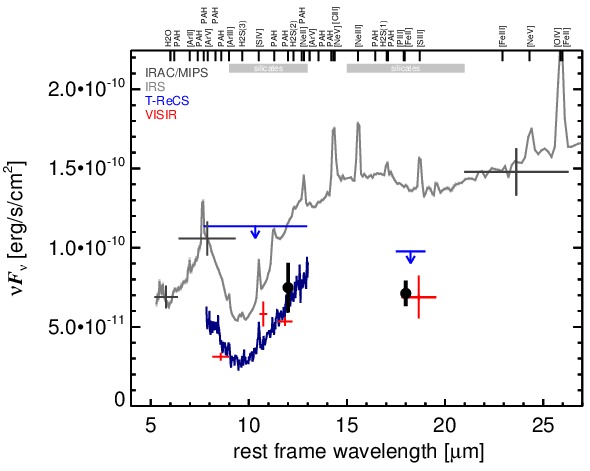
MIR SED. The description of the symbols in all the SED plots (where present) is the following: Grey crosses and solid lines mark the Spitzer/IRAC, MIPS and IRS data. The colour coding of the other symbols is as follows: green for COMICS, magenta for Michelle, blue for T-ReCS and red for VISIR data. Darker-coloured solid lines mark spectra of the corresponding instrument. The black filled circles mark the nuclear 12 and 18 micron continuum emission estimate from the data (where present). The ticks on the top axis mark positions of common MIR emission lines, while the light grey horizontal bars mark wavelength ranges affected by the silicate 10 and 18 micron features.