Sasmirala Individual Information for NGC 1433
Description
NGC 1433 is a low-inclination barred spiral galaxy at a distance of D = 8.3 ± 2.3 Mpc [tully_extragalactic_2009] with a possibly active nucleus, which has been classified as a Sy 2.0 [veron-cetty_study_1986] or a LINER [storchi-bergmann_ultraviolet_1995]. This AGN has barely been studied and in particular no X-ray works are available. At radio wavelengths only a low-angular resolution measurement was performed, which detected a weak non-thermal nuclear compact source (diameter~ 4arcmimin; PA~ 90∘; [harnett_radio_1987]). We conservatively treat NGC 1433 as uncertain AGN. In the MIR, NGC 1433 was first detected with IRAS and was followed up with ISO [roussel_atlas_2001] and Spitzer/IRAC, IRS and MIPS. Bright host galaxy emission with an elliptical core but no distinct unresolved component was detected in the corresponding IRAC and MIPS images. The IRS LR staring-mode spectrum is completely dominated by strong PAH emission features with a rather flat underlying continuum. None of the AGN-indicative high-ionization lines (e.g., [Ne V]) are clearly detected [pereira-santaella_mid-infrared_2010]. The nuclear region of NGC 1433 was imaged with T-ReCS in the Si2 filter in 2005 and with VISIR in the PAH2_2 filter in 2009 (both unpublished, to our knowledge). The derived flux upper limits are ~ 76% lower than the Spitzer spectrophotometry. Therefore, the presence of an AGN in NGC 1433 is highly uncertain and in any case much weaker than the host emission of the central ~ 150 pc.
- [harnett_radio_1987] J. I. Harnett. Radio continuum observations of nearby galaxies . MNRAS , 227 pp. 887–908, August 1987.
- [pereira-santaella_mid-infrared_2010] Miguel Pereira-Santaella, Aleksandar M. Diamond-Stanic, Almudena Alonso-Herrero, and George H. Rieke. The mid-infrared high-ionization lines from active galactic nuclei and star-forming galaxies . ApJ , 725 pp. 2270–2280, December 2010.
- [roussel_atlas_2001] H. Roussel, L. Vigroux, A. Bosma, M. Sauvage, C. Bonoli, P. Gallais, T. Hawarden, J. Lequeux, S. Madden, and P. Mazzei. An atlas of mid-infrared dust emission in spiral galaxies . A&A , 369 pp. 473–509, April 2001.
- [storchi-bergmann_ultraviolet_1995] Thaisa Storchi-Bergmann, Anne L. Kinney, and Peter Challis. Ultraviolet to near-infrared spectral distributions of star-forming and seyfert 2 galaxies . ApJS , 98 pp. 103, May 1995.
- [tully_extragalactic_2009] R. Brent Tully, Luca Rizzi, Edward J. Shaya, Hélène M. Courtois, Dmitry I. Makarov, and Bradley A. Jacobs. The extragalactic distance database . AJ , 138 pp. 323–331, August 2009.
- [veron-cetty_study_1986] M.-P. Veron-Cetty and P. Veron. Study of a complete sample of galaxies. II - spectroscopy of the nuclei . A&AS , 66 pp. 335–372, December 1986.
Images
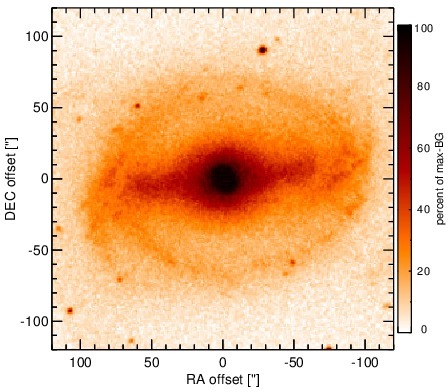
Optical image (DSS, red filter). Displayed are the central 4 arcmin with North being up and East to the left. The colour scaling is linear with white corresponding to the median background (BG) and black to the 0.01% pixels with the highest intensity.
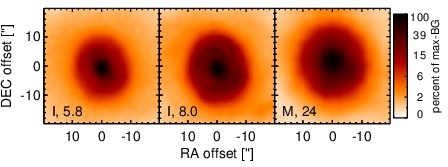
Spitzer MIR images. Displayed are the inner 40 arcsec with North being up and East to the left. The colour scaling is logarithmic with white corresponding to median BG and black to the 0.1% pixels with the highest intensity. The label in the bottom left states instrument and central wavelength of the filter in micron (I: IRAC, M: MIPS).
SEDs
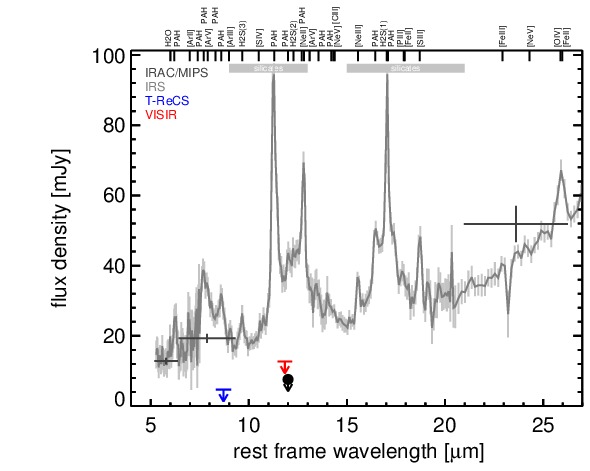
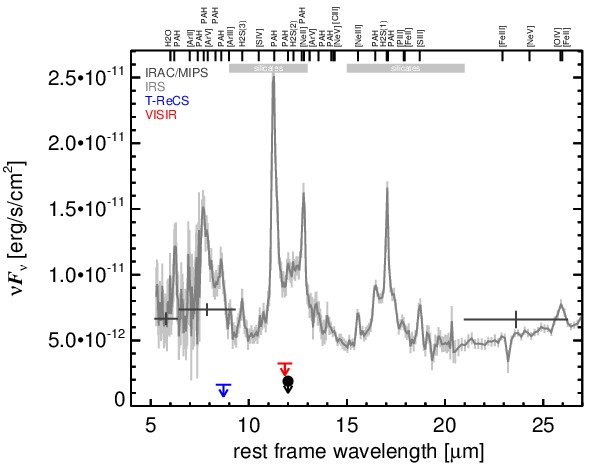
MIR SED. The description of the symbols in all the SED plots (where present) is the following: Grey crosses and solid lines mark the Spitzer/IRAC, MIPS and IRS data. The colour coding of the other symbols is as follows: green for COMICS, magenta for Michelle, blue for T-ReCS and red for VISIR data. Darker-coloured solid lines mark spectra of the corresponding instrument. The black filled circles mark the nuclear 12 and 18 micron continuum emission estimate from the data (where present). The ticks on the top axis mark positions of common MIR emission lines, while the light grey horizontal bars mark wavelength ranges affected by the silicate 10 and 18 micron features.