Sasmirala Individual Information for NGC 1553
Description
NGC 1553 is an inclined early-type spiral galaxy interacting with NGC 1549 (11.5arcmimin away) at a distance of D = 16.4 ± 5.1 Mpc (NED redshift-independent median) with an active nucleus, classified as a LINER or transition object [flohic_central_2006]. The presence of an AGN in NGC 1553 is supported by the detection of a compact source in radio [harnett_radio_1987] and in X-rays [blanton_diffuse_2001, flohic_central_2006]. After its detection in IRAS, NGC 1553 was observed with ISO [temi_cold_2004] and with Spitzer/IRS and MIPS. In the MIPS 24 μm image, a compact north-west elongated MIR nucleus (PA~-30∘) embedded within prominent diffuse host emission was detected. Because we measure only the unresolved nuclear component, our MIPS 24 μm flux value is significantly lower than in [temi_spitzer_2009]. The IRS LR staring-mode spectrum exhibits silicate 10 μm and possibly silicate 18 μm emission, a prominent PAH 11.3 μm feature and a blue spectral slope in νFν-space, indicating mainly passive host emission (see also [panuzzo_nearby_2011]). The nuclear region of NGC 1553 was observed with VISIR in the PAH2_2 filter in 2009 (unpublished, to our knowledge) but no nuclear source was detected. Our derived flux upper limit is significantly lower than the Spitzer spectrophotometry. Therefore, from the subarcsecond MIR point of view no definite conclusion can be drawn about the presence of an AGN in NGC 1553 but note that [panuzzo_nearby_2011] have detected weak [Ne V] emission in the IRS spectrum.
- [blanton_diffuse_2001] Elizabeth L. Blanton, Craig L. Sarazin, and Jimmy A. Irwin. Diffuse gas and low-mass x-ray binaries in the chandra observation of the s0 galaxy NGC 1553 . ApJ , 552 pp. 106–119, May 2001.
- [flohic_central_2006] Hélène M. L. G. Flohic, Michael Eracleous, George Chartas, Joseph C. Shields, and Edward C. Moran. The central engines of 19 LINERs as viewed by chandra . ApJ , 647 pp. 140–160, August 2006.
- [harnett_radio_1987] J. I. Harnett. Radio continuum observations of nearby galaxies . MNRAS , 227 pp. 887–908, August 1987.
- [panuzzo_nearby_2011] P. Panuzzo, R. Rampazzo, A. Bressan, O. Vega, F. Annibali, L. M. Buson, M. S. Clemens, and W. W. Zeilinger. Nearby early-type galaxies with ionized gas. VI. the spitzer-IRS view. basic data set analysis and empirical spectral classification . A&A , 528 pp. 10, April 2011.
- [temi_cold_2004] Pasquale Temi, Fabrizio Brighenti, William G. Mathews, and Jesse D. Bregman. Cold dust in early-type galaxies. i. observations . ApJS , 151 pp. 237–269, April 2004.
- [temi_spitzer_2009] Pasquale Temi, Fabrizio Brighenti, and William G. Mathews. Spitzer observations of passive and star-forming early-type galaxies: An infrared color-color sequence . ApJ , 707 pp. 890–902, December 2009.
Images
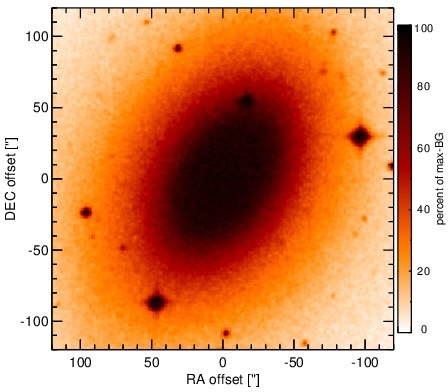
Optical image (DSS, red filter). Displayed are the central 4 arcmin with North being up and East to the left. The colour scaling is linear with white corresponding to the median background (BG) and black to the 0.01% pixels with the highest intensity.
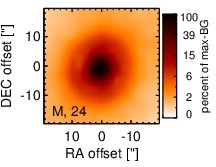
Spitzer MIR images. Displayed are the inner 40 arcsec with North being up and East to the left. The colour scaling is logarithmic with white corresponding to median BG and black to the 0.1% pixels with the highest intensity. The label in the bottom left states instrument and central wavelength of the filter in micron (I: IRAC, M: MIPS).
SEDs
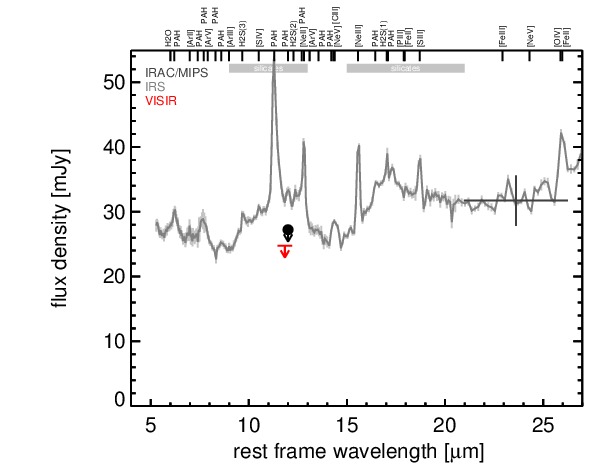
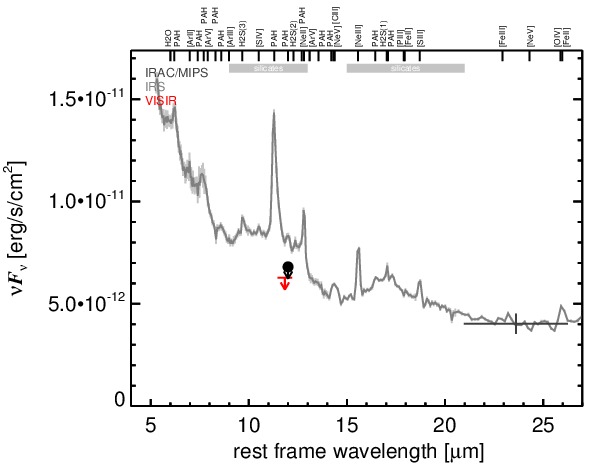
MIR SED. The description of the symbols in all the SED plots (where present) is the following: Grey crosses and solid lines mark the Spitzer/IRAC, MIPS and IRS data. The colour coding of the other symbols is as follows: green for COMICS, magenta for Michelle, blue for T-ReCS and red for VISIR data. Darker-coloured solid lines mark spectra of the corresponding instrument. The black filled circles mark the nuclear 12 and 18 micron continuum emission estimate from the data (where present). The ticks on the top axis mark positions of common MIR emission lines, while the light grey horizontal bars mark wavelength ranges affected by the silicate 10 and 18 micron features.