Sasmirala Individual Information for NGC 1566
Description
NGC 1566 is a face-on grand-design spiral galaxy at a distance of D = 14.3 ± 5.9 Mpc (average of [tully_nearby_1988], [willick_homogeneous_1997] and DL from NED) with a Sy 1.5 nucleus, which in the past showed spectral variation ranging between Sy 1.2 and Sy 1.9 [alloin_recent_1985, alloin_recurrent_1986]. It appears point-like at radio wavelengths (e.g., [morganti_radio_1999]). The NLR forms in projection a short but wide cone extending ~ 0.5arcsec ~ 35 pc to the south-east (PA~ 135∘; e.g., [schmitt_comparison_1996]). After its detection in IRAS, NGC 1566 was observed in the MIR with ISO [clavel_2.5-11_2000, ramos_almeida_mid-infrared_2007] and ESO MPI 2.2 m/MANIAC [krabbe_n-band_2001], where the nucleus appeared unresolved. In the IRAC and MIPS images, a compact MIR nucleus embedded within diffuse extended emission and on larger scale surrounded by spiral-like emission was detected. Me measure the nuclear component only, which provides IRAC 5.8 and 8.0 μm and MIPS 24 μm fluxes significantly lower than the values by e.g., [dale_infrared_2005, munoz-mateos_radial_2009, gallimore_infrared_2010]. The IRS LR mapping-mode spectrum shows strong PAH emission, possible weak silicate 10 μm absorption and a rather flat spectral slope in νFν-space (see [smith_mid-infrared_2007, wu_spitzer/irs_2009, gallimore_infrared_2010] for more accurate versions). Thus, the MIR SED at arcsecond scales appears star-formation dominated. The nuclear region of NGC 1566 was observed with T-ReCS in the Si2 and Qa filters in 2005 [ramos_almeida_infrared_2009], and with VISIR in total in five narrow N-band and one Q-band filters spread over 2006 [reunanen_vlt_2010], 2009 [asmus_mid-infrared_2011] and 2010 (this work). In all cases, a compact MIR nucleus without any other host emission was detected. Note that for the T-ReCS images no corresponding standard star could be retrieved, and thus median flux conversion factors are used. The nucleus appears marginally resolved in all VISIR images except in the diffraction-limited PAH2_2 image from 2006 but with inconsistent position angles. Therefore, it remains uncertain, whether the MIR nucleus of NGC 1566 is in general extended at subarcsecond resolution. On the other hand, the N-band images with the largest FWHM values (PAH2 and NEII_1; ~ 0.5arcsec) also exhibit two times higher fluxes than in the SIV_2 and PAH2_2 filters with small FWHM values. It is thus possible, that the PAH2 and NEII_1 filters are significantly affected by extended emission, e.g., PAH. Deep subarcsecond-resolution MIR images covering the N-band obtained under good conditions are required to verify the nuclear MIR structure. The nuclear photometry in general is consistent with the previously published values and on average ~ 49% lower than the Spitzer spectrophotometry. We conclude that star formation dominates the MIR emission form the projected central ~ 250 pc in NGC 1566.
- [alloin_recent_1985] D. Alloin, D. Pelat, M. Phillips, and M. Whittle. Recent spectral variations in the active nucleus of NGC 1566 . ApJ , 288 pp. 205–220, January 1985.
- [alloin_recurrent_1986] D. Alloin, D. Pelat, M. M. Phillips, R. A. E. Fosbury, and K. Freeman. Recurrent outbursts in the broad-line region of NGC 1566 . ApJ , 308 pp. 23–35, September 1986.
- [asmus_mid-infrared_2011] D. Asmus, P. Gandhi, A. Smette, S. F. Hönig, and W. J. Duschl. Mid-infrared properties of nearby low-luminosity AGN at high angular resolution . A&A , 536 pp. 36, December 2011.
- [clavel_2.5-11_2000] J. Clavel, B. Schulz, B. Altieri, P. Barr, P. Claes, A. Heras, K. Leech, L. Metcalfe, and A. Salama. 2.5-11 micron spectroscopy and imaging of AGNs. implication for unification schemes . A&A , 357 pp. 839–849, May 2000.
- [dale_infrared_2005] D. A. Dale, G. J. Bendo, C. W. Engelbracht, K. D. Gordon, M. W. Regan, L. Armus, J. M. Cannon, D. Calzetti, B. T. Draine, G. Helou, R. D. Joseph, R. C. Kennicutt, A. Li, E. J. Murphy, H. Roussel, F. Walter, H. M. Hanson, D. J. Hollenbach, T. H. Jarrett, L. J. Kewley, C. A. Lamanna, C. Leitherer, M. J. Meyer, G. H. Rieke, M. J. Rieke, K. Sheth, J. D. T. Smith, and M. D. Thornley. Infrared spectral energy distributions of nearby galaxies . ApJ , 633 pp. 857–870, November 2005.
- [gallimore_infrared_2010] J. F. Gallimore, A. Yzaguirre, J. Jakoboski, M. J. Stevenosky, D. J. Axon, S. A. Baum, C. L. Buchanan, M. Elitzur, M. Elvis, C. P. O'Dea, and A. Robinson. Infrared spectral energy distributions of seyfert galaxies: Spitzer space telescope observations of the 12 μm sample of active galaxies . ApJS , 187 pp. 172–211, March 2010.
- [krabbe_n-band_2001] Alfred Krabbe, Torsten Böker, and Roberto Maiolino. N-band imaging of seyfert nuclei and the mid-infrared-x-ray correlation . ApJ , 557 pp. 626–636, August 2001.
- [morganti_radio_1999] R. Morganti, Z. I. Tsvetanov, J. Gallimore, and M. G. Allen. Radio continuum morphology of southern seyfert galaxies . A&AS , 137 pp. 457–471, June 1999.
- [munoz-mateos_radial_2009] J. C. Muñoz-Mateos, A. Gil de Paz, J. Zamorano, S. Boissier, D. A. Dale, P. G. Pérez-González, J. Gallego, B. F. Madore, G. Bendo, A. Boselli, V. Buat, D. Calzetti, J. Moustakas, and R. C. Kennicutt. Radial distribution of stars, gas, and dust in SINGS galaxies. i. surface photometry and morphology . ApJ , 703 pp. 1569–1596, October 2009.
- [ramos_almeida_infrared_2009] C. Ramos Almeida, N. A. Levenson, J. M. Rodríguez Espinosa, A. Alonso-Herrero, A. Asensio Ramos, J. T. Radomski, C. Packham, R. S. Fisher, and C. M. Telesco. The infrared nuclear emission of seyfert galaxies on parsec scales: Testing the clumpy torus models . ApJ , 702 pp. 1127–1149, September 2009.
- [ramos_almeida_mid-infrared_2007] C. Ramos Almeida, A. M. Pérez García, J. A. Acosta-Pulido, and J. M. Rodríguez Espinosa. The mid-infrared emission of seyfert galaxies: A new analysis of ISOCAM data . AJ , 134 pp. 2006–2019, November 2007.
- [reunanen_vlt_2010] J. Reunanen, M. A. Prieto, and R. Siebenmorgen. VLT diffraction-limited imaging at 11 and 18μm of the nearest active galactic nuclei . MNRAS , 402 pp. 879–894, February 2010.
- [schmitt_comparison_1996] Henrique R. Schmitt and Anne L. Kinney. A comparison between the narrow-line regions of seyfert 1 and seyfert 2 galaxies . ApJ , 463 pp. 498, June 1996.
- [smith_mid-infrared_2007] J. D. T. Smith, B. T. Draine, D. A. Dale, J. Moustakas, R. C. Kennicutt, G. Helou, L. Armus, H. Roussel, K. Sheth, G. J. Bendo, B. A. Buckalew, D. Calzetti, C. W. Engelbracht, K. D. Gordon, D. J. Hollenbach, A. Li, S. Malhotra, E. J. Murphy, and F. Walter. The mid-infrared spectrum of star-forming galaxies: Global properties of polycyclic aromatic hydrocarbon emission . ApJ , 656 pp. 770–791, February 2007.
- [tully_nearby_1988] R. Brent Tully. Nearby galaxies catalog . Cambridge University Press, 1988.
- [willick_homogeneous_1997] Jeffrey A. Willick, Stephane Courteau, S. M. Faber, David Burstein, Avishai Dekel, and Michael A. Strauss. Homogeneous velocity-distance data for peculiar velocity analysis. III. the mark III catalog of galaxy peculiar velocities . ApJS , 109 pp. 333, April 1997.
- [wu_spitzer/irs_2009] Yanling Wu, Vassilis Charmandaris, Jiasheng Huang, Luigi Spinoglio, and Silvia Tommasin. Spitzer/IRS 5-35 μm low-resolution spectroscopy of the 12 μm seyfert sample . ApJ , 701 pp. 658–676, August 2009.
Images
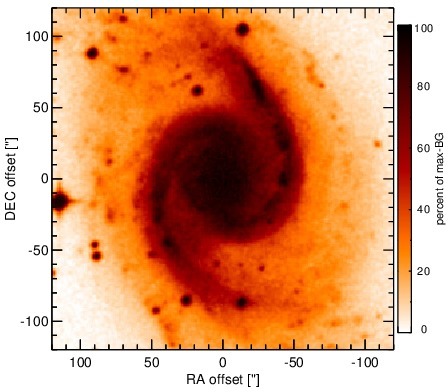
Optical image (DSS, red filter). Displayed are the central 4 arcmin with North being up and East to the left. The colour scaling is linear with white corresponding to the median background (BG) and black to the 0.01% pixels with the highest intensity.
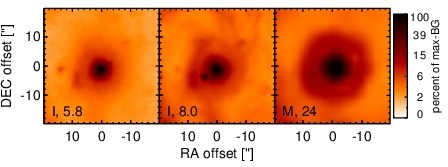
Spitzer MIR images. Displayed are the inner 40 arcsec with North being up and East to the left. The colour scaling is logarithmic with white corresponding to median BG and black to the 0.1% pixels with the highest intensity. The label in the bottom left states instrument and central wavelength of the filter in micron (I: IRAC, M: MIPS).
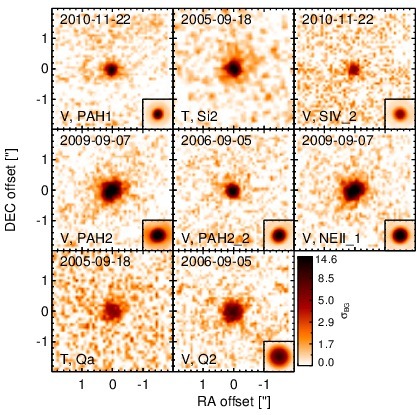
Subarcsecond-resolution MIR images sorted by increasing filter central wavelength. Displayed are the inner 4 arcsec with North being up and East to the left. The colour scaling is logarithmic with white corresponding to median BG and black to the 75% of the highest intensity of all images in units of sig_bg. The inset image (where present; either bottom or top right) shows the central arcsecond of the PSF from the calibrator star, scaled to match the science target. The labels in the bottom left state instrument and filter names (C: COMICS, M: Michelle, T: T-ReCS, V: VISIR).
SEDs
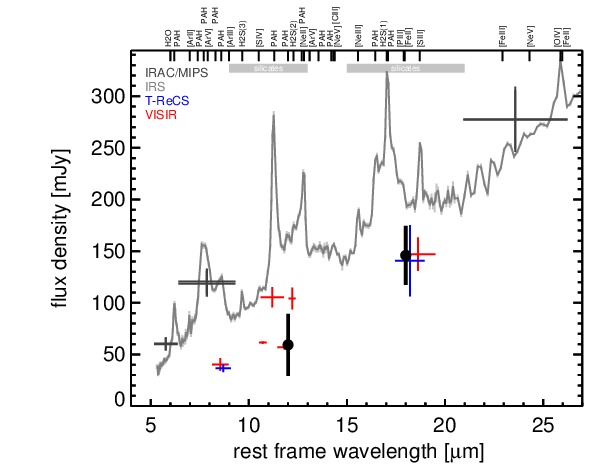
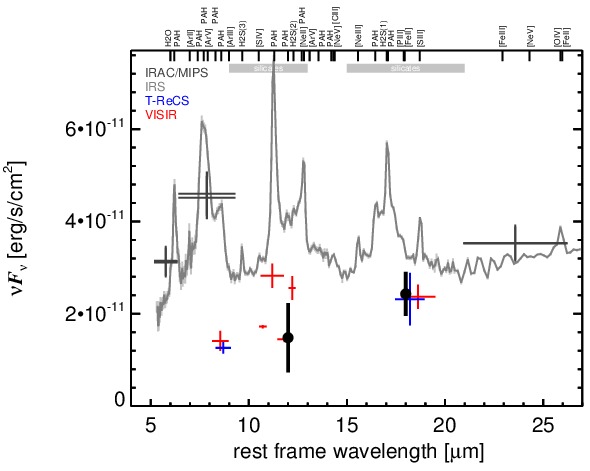
MIR SED. The description of the symbols in all the SED plots (where present) is the following: Grey crosses and solid lines mark the Spitzer/IRAC, MIPS and IRS data. The colour coding of the other symbols is as follows: green for COMICS, magenta for Michelle, blue for T-ReCS and red for VISIR data. Darker-coloured solid lines mark spectra of the corresponding instrument. The black filled circles mark the nuclear 12 and 18 micron continuum emission estimate from the data (where present). The ticks on the top axis mark positions of common MIR emission lines, while the light grey horizontal bars mark wavelength ranges affected by the silicate 10 and 18 micron features.