Sasmirala Individual Information for NGC 1667
Description
NGC 1667 is a low-inclination infrared-luminous spiral galaxy at a redshift of z = 0.0152 (D ~ 67.8 Mpc) with a Sy 2 nucleus [veron-cetty_catalogue_2010], which is also detected as compact core in radio (e.g., [ho_radio_2001]). After its detection in IRAS, NGC 1667 was measured in the N-band but uncertainly detected with the MMT [maiolino_new_1995]. The nucleus remained undetected in the subarcsecond-resolution N-band imaging with Palomar 5 m/MIRLIN [gorjian_10_2004]. NGC 1667 was also observed with ISO [clavel_2.5-11_2000, ramos_almeida_mid-infrared_2007] and Spitzer/IRAC, IRS and MIPS. In the corresponding IRAC and MIPS images, a compact nucleus embedded within diffuse host emission and surrounded by further spiral-like host emission was detected. The latter is brighter than the nucleus in the IRAC 8 μm and MIPS 24 μm images. We measure the nuclear component only providing IRAC 5.8 and 8.0 μm fluxes significantly lower than the values in [gallimore_infrared_2010] but in rough agreement with the IRS LR mapping-mode spectrum. The IRS spectrum suffers from low S/N but indicates prominent PAH emission and a red spectral slope in νFν-space, reminiscent of star formation (see also [wu_spitzer/irs_2009, tommasin_spitzer-irs_2010, gallimore_infrared_2010]). NGC 1667 was observed with T-ReCS in the broad N filter in 2004 (unpublished, to our knowledge), and with VISIR in two narrow N-band filters in 2009 [asmus_mid-infrared_2011]. In the T-ReCS image, a compact MIR nucleus is weakly detected, while it remained undetected in the VISIR images. The MIR nucleus is possibly marginally resolved with a FWHM(major axis)~ 0.52arcsec ~ 170 pc and a PA~ 54∘. However, at least a second epoch with a detection in the MIR at subarcsecond resolution is required to confirm this extension. The nuclear N flux is ~ 43% lower than the Spitzer spectrophotometry, which indicates that star formation dominates the total MIR emission in the central kiloparsec of NGC 1667.
- [asmus_mid-infrared_2011] D. Asmus, P. Gandhi, A. Smette, S. F. Hönig, and W. J. Duschl. Mid-infrared properties of nearby low-luminosity AGN at high angular resolution . A&A , 536 pp. 36, December 2011.
- [clavel_2.5-11_2000] J. Clavel, B. Schulz, B. Altieri, P. Barr, P. Claes, A. Heras, K. Leech, L. Metcalfe, and A. Salama. 2.5-11 micron spectroscopy and imaging of AGNs. implication for unification schemes . A&A , 357 pp. 839–849, May 2000.
- [gallimore_infrared_2010] J. F. Gallimore, A. Yzaguirre, J. Jakoboski, M. J. Stevenosky, D. J. Axon, S. A. Baum, C. L. Buchanan, M. Elitzur, M. Elvis, C. P. O'Dea, and A. Robinson. Infrared spectral energy distributions of seyfert galaxies: Spitzer space telescope observations of the 12 μm sample of active galaxies . ApJS , 187 pp. 172–211, March 2010.
- [gorjian_10_2004] V. Gorjian, M. W. Werner, T. H. Jarrett, D. M. Cole, and M. E. Ressler. 10 micron imaging of seyfert galaxies from the 12 micron sample . ApJ , 605 pp. 156–167, April 2004.
- [ho_radio_2001] Luis C. Ho and James S. Ulvestad. Radio continuum survey of an optically selected sample of nearby seyfert galaxies . ApJS , 133 pp. 77–118, March 2001.
- [maiolino_new_1995] R. Maiolino, M. Ruiz, G. H. Rieke, and L. D. Keller. New constraints on the unified model of seyfert galaxies . ApJ , 446 pp. 561, June 1995.
- [ramos_almeida_mid-infrared_2007] C. Ramos Almeida, A. M. Pérez García, J. A. Acosta-Pulido, and J. M. Rodríguez Espinosa. The mid-infrared emission of seyfert galaxies: A new analysis of ISOCAM data . AJ , 134 pp. 2006–2019, November 2007.
- [tommasin_spitzer-irs_2010] Silvia Tommasin, Luigi Spinoglio, Matthew A. Malkan, and Giovanni Fazio. Spitzer-IRS high-resolution spectroscopy of the 12 μm seyfert galaxies. II. results for the complete data set . ApJ , 709 pp. 1257–1283, February 2010.
- [veron-cetty_catalogue_2010] M.-P. Véron-Cetty and P. Véron. A catalogue of quasars and active nuclei: 13th edition . A&A , 518 pp. 10, July 2010.
- [wu_spitzer/irs_2009] Yanling Wu, Vassilis Charmandaris, Jiasheng Huang, Luigi Spinoglio, and Silvia Tommasin. Spitzer/IRS 5-35 μm low-resolution spectroscopy of the 12 μm seyfert sample . ApJ , 701 pp. 658–676, August 2009.
Images
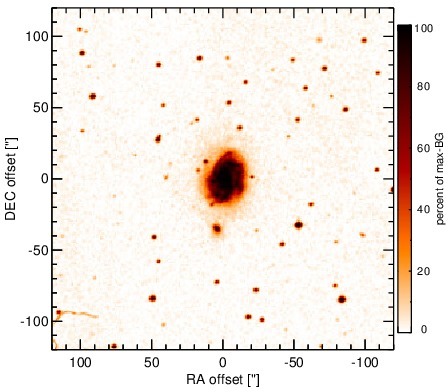
Optical image (DSS, red filter). Displayed are the central 4 arcmin with North being up and East to the left. The colour scaling is linear with white corresponding to the median background (BG) and black to the 0.01% pixels with the highest intensity.
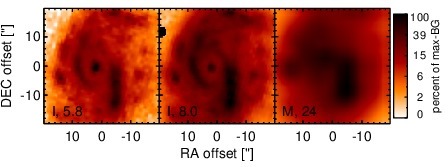
Spitzer MIR images. Displayed are the inner 40 arcsec with North being up and East to the left. The colour scaling is logarithmic with white corresponding to median BG and black to the 0.1% pixels with the highest intensity. The label in the bottom left states instrument and central wavelength of the filter in micron (I: IRAC, M: MIPS).
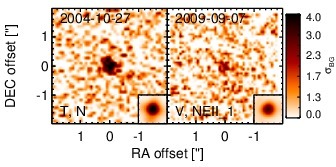
Subarcsecond-resolution MIR images sorted by increasing filter central wavelength. Displayed are the inner 4 arcsec with North being up and East to the left. The colour scaling is logarithmic with white corresponding to median BG and black to the 75% of the highest intensity of all images in units of sig_bg. The inset image (where present; either bottom or top right) shows the central arcsecond of the PSF from the calibrator star, scaled to match the science target. The labels in the bottom left state instrument and filter names (C: COMICS, M: Michelle, T: T-ReCS, V: VISIR).
SEDs
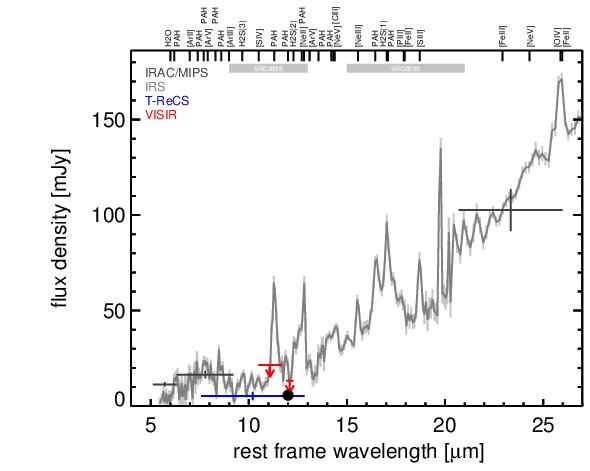
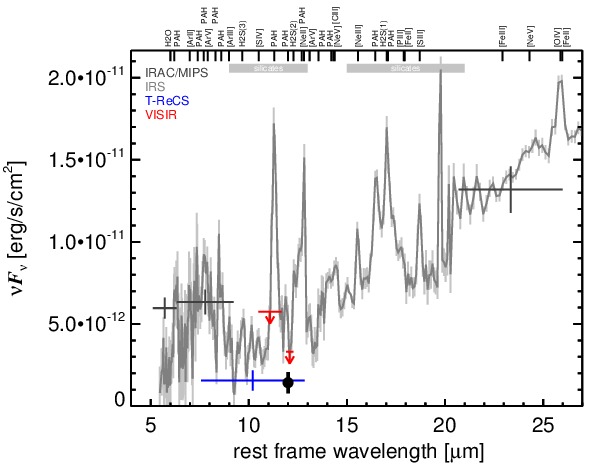
MIR SED. The description of the symbols in all the SED plots (where present) is the following: Grey crosses and solid lines mark the Spitzer/IRAC, MIPS and IRS data. The colour coding of the other symbols is as follows: green for COMICS, magenta for Michelle, blue for T-ReCS and red for VISIR data. Darker-coloured solid lines mark spectra of the corresponding instrument. The black filled circles mark the nuclear 12 and 18 micron continuum emission estimate from the data (where present). The ticks on the top axis mark positions of common MIR emission lines, while the light grey horizontal bars mark wavelength ranges affected by the silicate 10 and 18 micron features.