Sasmirala Individual Information for NGC 2110
Description
NGC 2110 is a spiral galaxy at a distance of D = ~ 33 Mpc (z ~ 0.0078) with a low-luminosity Sy 2 nucleus [bradt_ngc_1978] with broad emission lines in polarized and near-infrared light [moran_transient_2007, reunanen_near-infrared_2003]. The AGN is at the border to the LINER regime [kewley_optical_2001, yuan_role_2010] and belongs to the nine-month BAT AGN sample. Radio observations with the VLA found a S-shaped jet structure that extends in total 4arcsec symmetrically in the north-south directions [ulvestad_nuclear_1983, nagar_radio_1999]. This implies that the AGN is seen edge-on, which is also supported by the NLR structure following roughly the jet structure [mulchaey_hubble_1994] and the polarization orientation of the broad Hα emission [moran_transient_2007]. Early MIR observations were performed by [roche_8-13_1984] and [lawrence_observations_1985]. NGC 2110 was observed with Spitzer/IRS and MIPS, while no IRAC images are available. It appears compact in MIPS 24 μm, and our flux measurement agrees with the value given by [temi_spitzer_2009]. The IRS spectrum shows strong silicate emission (both at 10 and 18 μm), forbidden emission lines and also PAH 11.3 μm emission (see also [shi_9.7_2006, mason_origin_2009]). The first high angular resolution MIR study of NGC 2110 was done by [mason_origin_2009], comparing the Spitzer data to Michelle N-band spectrophotometry. Our reanalysis of the broad N-band Michelle image yields results consistent with theirs. In addition, also VISIR N-band spectrophotometry was performed [honig_dusty_2010], and again our reanalysis is consistent with the original work. Furthermore, a Q-band and two narrow N-band VISIR images were taken by our group. NGC 2110 appears compact in all HR MIR images without any non-nuclear emission being detected neither from the jet nor the host galaxy. Our quantitative analysis indicates that the nucleus is possibly marginally resolved with a position angle ~ 90∘ (FWHM at 12 μm ~ 57 pc ~ 0.36). The general MIR flux level of the HR data is ~ 10% lower than in Spitzer and the PAH 11.3 μm feature is absent (see also [esquej_nuclear_2014]). NGC 2110 is one of the most prominent cases of those few Seyfert 2s that show strong silicate emission (see also [mason_origin_2009]). Interestingly, the MIR flux level of NGC 2110 has been rising since 2006 (VISIR first epoch) over 2007 (Michelle) to 2010 (VISIR second epoch).
- [bradt_ngc_1978] H. V. Bradt, B. F. Burke, C. R. Canizares, P. E. Greenfield, R. L. Kelley, J. E. McClintock, J. van Paradijs, and A. T. Koski. NGC 2110 - an x-ray/radio galaxy with elliptical morphology . ApJL , 226 pp. L111–L114, December 1978.
- [esquej_nuclear_2014] P. Esquej, A. Alonso-Herrero, O. González-Martín, S. F. Hönig, A. Hernán-Caballero, P. Roche, C. Ramos Almeida, R. E. Mason, T. Díaz-Santos, N. A. Levenson, I. Aretxaga, J. M. Rodríguez Espinosa, and C. Packham. Nuclear star formation activity and black hole accretion in nearby seyfert galaxies . ApJ , 780 pp. 86, January 2014.
- [honig_dusty_2010] S. F. Hönig and M. Kishimoto. The dusty heart of nearby active galaxies. II. from clumpy torus models to physical properties of dust around AGN . A&A , 523 pp. 27, November 2010.
- [kewley_optical_2001] L. J. Kewley, C. A. Heisler, M. A. Dopita, and S. Lumsden. Optical classification of southern warm infrared galaxies . ApJS , 132 pp. 37–71, January 2001.
- [lawrence_observations_1985] A. Lawrence, M. Ward, M. Elvis, G. Fabbiano, S. P. Willner, N. P. Carleton, and A. Longmore. Observations from 1 to 20 microns of low-luminosity active galaxies . ApJ , 291 pp. 117–127, April 1985.
- [mason_origin_2009] R. E. Mason, N. A. Levenson, Y. Shi, C. Packham, V. Gorjian, K. Cleary, J. Rhee, and M. Werner. The origin of the silicate emission features in the seyfert 2 galaxy NGC 2110 . ApJ , 693 pp. L136–L140, March 2009.
- [moran_transient_2007] Edward C. Moran, Aaron J. Barth, Michael Eracleous, and Laura E. Kay. Transient and highly polarized double-peaked hα emission in the seyfert 2 nucleus of NGC 2110 . ApJL , 668 pp. L31–L34, October 2007.
- [mulchaey_hubble_1994] John S. Mulchaey, Andrew S. Wilson, Gary A. Bower, Timothy M. Heckman, Julian H. Krolik, and George K. Miley. Hubble space telescope imaging of the seyfert 2 galaxy NGC 2110 . ApJ , 433 pp. 625–630, October 1994.
- [nagar_radio_1999] Neil M. Nagar, Andrew S. Wilson, John S. Mulchaey, and Jack F. Gallimore. Radio structures of seyfert galaxies. VIII. a distance- and magnitude-limited sample of early-type galaxies . ApJS , 120 pp. 209–245, February 1999.
- [reunanen_near-infrared_2003] J. Reunanen, J. K. Kotilainen, and M. A. Prieto. Near-infrared spectroscopy of nearby seyfert galaxies - II. molecular content and coronal emission . MNRAS , 343 pp. 192–208, July 2003.
- [roche_8-13_1984] P. F. Roche, B. Whitmore, D. K. Aitken, and M. M. Phillips. 8-13 micron spectrophotometry of galaxies. II - 10 seyferts and 3C 273 . MNRAS , 207 pp. 35–45, March 1984.
- [shi_9.7_2006] Y. Shi, G. H. Rieke, D. C. Hines, V. Gorjian, M. W. Werner, K. Cleary, F. J. Low, P. S. Smith, and J. Bouwman. 9.7 μm silicate features in active galactic nuclei: New insights into unification models . ApJ , 653 pp. 127–136, December 2006.
- [temi_spitzer_2009] Pasquale Temi, Fabrizio Brighenti, and William G. Mathews. Spitzer observations of passive and star-forming early-type galaxies: An infrared color-color sequence . ApJ , 707 pp. 890–902, December 2009.
- [ulvestad_nuclear_1983] J. S. Ulvestad and A. S. Wilson. The nuclear radio source of the x-ray galaxy NGC 2110 . ApJL , 264 pp. L7–L11, January 1983.
- [yuan_role_2010] T.-T. Yuan, L. J. Kewley, and D. B. Sanders. The role of starburst-active galactic nucleus composites in luminous infrared galaxy mergers: Insights from the new optical classification scheme . ApJ , 709 pp. 884–911, February 2010.
Images
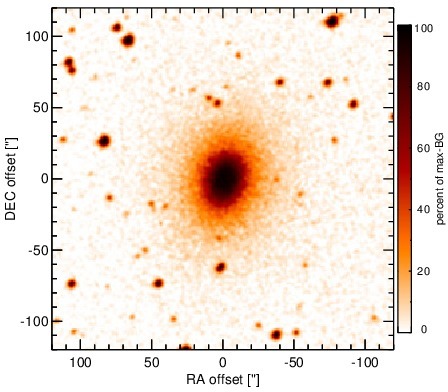
Optical image (DSS, red filter). Displayed are the central 4 arcmin with North being up and East to the left. The colour scaling is linear with white corresponding to the median background (BG) and black to the 0.01% pixels with the highest intensity.
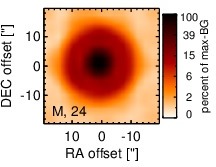
Spitzer MIR images. Displayed are the inner 40 arcsec with North being up and East to the left. The colour scaling is logarithmic with white corresponding to median BG and black to the 0.1% pixels with the highest intensity. The label in the bottom left states instrument and central wavelength of the filter in micron (I: IRAC, M: MIPS).
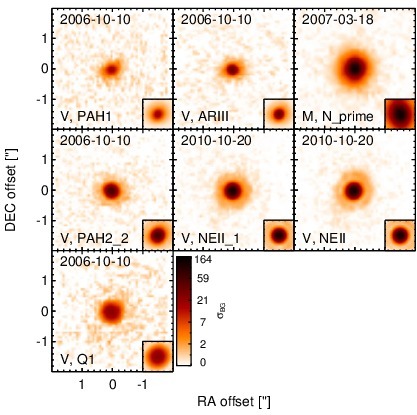
Subarcsecond-resolution MIR images sorted by increasing filter central wavelength. Displayed are the inner 4 arcsec with North being up and East to the left. The colour scaling is logarithmic with white corresponding to median BG and black to the 75% of the highest intensity of all images in units of sig_bg. The inset image (where present; either bottom or top right) shows the central arcsecond of the PSF from the calibrator star, scaled to match the science target. The labels in the bottom left state instrument and filter names (C: COMICS, M: Michelle, T: T-ReCS, V: VISIR).
SEDs
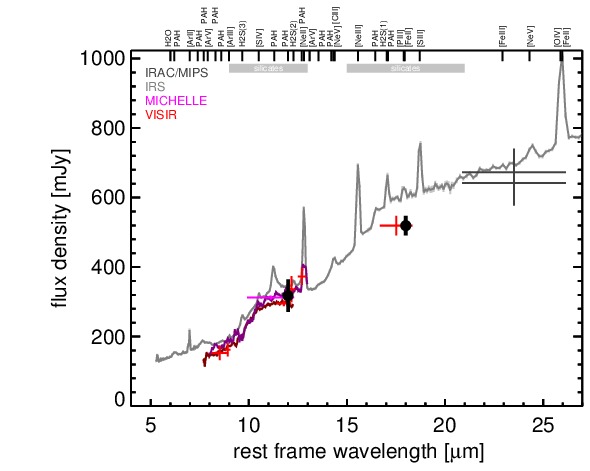
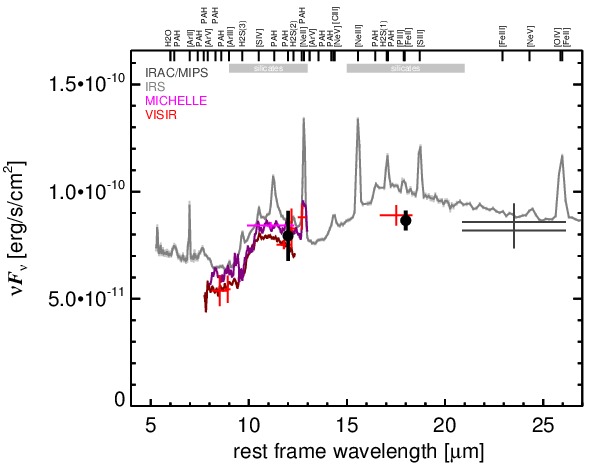
MIR SED. The description of the symbols in all the SED plots (where present) is the following: Grey crosses and solid lines mark the Spitzer/IRAC, MIPS and IRS data. The colour coding of the other symbols is as follows: green for COMICS, magenta for Michelle, blue for T-ReCS and red for VISIR data. Darker-coloured solid lines mark spectra of the corresponding instrument. The black filled circles mark the nuclear 12 and 18 micron continuum emission estimate from the data (where present). The ticks on the top axis mark positions of common MIR emission lines, while the light grey horizontal bars mark wavelength ranges affected by the silicate 10 and 18 micron features.