Sasmirala Individual Information for NGC 253
Description
NGC 253 is an edge-on spiral galaxy at a distance of D = 3.2 ± 0.6 Mpc (NED redshift-independent median) with an active nucleus dominated by a powerful starburst [engelbracht_nuclear_1998], which according to the optical classification, is a starburst/LINER transition nucleus. Narrow-line [O III] emission [tadhunter_optical_1993], a compact non-thermal radio source, TH2 [turner_1_1985], and an obscured compact X-ray source, X-1 [weaver_chandra_2002], are detected in the nucleus, suggesting the presence of an obscured AGN (see also [mohan_very_2002]). On the other hand, no compact nuclear source could be detected with VLBI in radio [brunthaler_evidence_2009] or with subarcsecond MIR imaging [fernandez-ontiveros_nucleus_2009]. In addition, [muller-sanchez_stellar_2010] argue that the positions of TH2 and X-1 are not consistent with each other, i.e., instead of a buried AGN, the nucleus could also be Sgr A*-like when associated with TH2 only. NGC 253 was discovered as a bright MIR source by [becklin_infrared_1973] and since then target of a large number of N- and Q-band photometric and spectroscopic studies [rieke_nucleus_1975, gillett_observations_1975, rieke_10_1978, beck_ne_1979, roche_8-13-micron_1985, ho_excess_1989, pina_12_1992, keto_mid-infrared_1993, telesco_genesis_1993, boeker_mid-infrared_1998, engelbracht_nuclear_1998, dudley_8-13_1999, keto_super-star_1999, rigopoulou_large_1999, sturm_iso-sws_2000, forster_schreiber_isocam_2003]. The first subarcsecond-resolution N-band image was obtained by [galliano_mid-infrared_2005] with ESO 3.6 m/TIMMI2, where the nuclear region of NGC 253 is resolved in six sources embedded within diffuse emission with ~ 15arcsec ~ 225 pc north-east extent (see also [raban_core_2008]). Notably, the brighter MIR source, M1 does not coincide with the nucleus, instead the latter might correspond to M3. Such an extended structure is also indicated in the IRAC 5.8 and 8.0 μm and MIPS 24 μm PBCD images, which are completely saturated and thus not analysed (but see [dale_spitzer_2009]). Owing to the complex extended MIR morphology of NGC 253, the IRS LR PBCD spectrum is not reliable and only qualitatively examined. The MIR SED is prototypical for star formation with strong PAH features, silicate 10 μm absorption an a red spectral slope in νFν-space (see also [devost_spitzer_2004, goulding_towards_2009]). The nuclear region of NGC 253 was also observed with VISIR in PAH2 and PAH2_2 in 2004 and in SIV and Q2 in 2005. The Q2 image was published by [fernandez-ontiveros_nucleus_2009] along with the Q2 and PAH2_2 fluxes of the emission knots. The VISIR images show the same MIR morphology as the previous TIMMI2 images. We perform manually scaled PSF photometry at the approximated expected nuclear position to derive upper limits on any AGN emission component. These fluxes are on average ~ 21% of the Spitzer spectrophotometry, which demonstrates that the star formation completely dominates the nuclear MIR emission of NGC 253. Therefore, it is also not surprising that no compact MIR source could be detected with MIDI [tristram_parsec-scale_2009].
- [beck_ne_1979] S. C. Beck, J. H. Lacy, and T. R. Geballe. NE II emission and galactic dynamics in NGC 253 . ApJ , 231 pp. 28–31, July 1979.
- [becklin_infrared_1973] E. E. Becklin, E. B. Fomalont, and G. Neugebauer. Infrared and radio observations of the nucleus of NGC 253 . ApJL , 181 pp. L27, April 1973.
- [boeker_mid-infrared_1998] Torsten Boeker, Alfred Krabbe, and John W. V. Storey. Mid-infrared [ne ii] line emission from the nucleus of NGC 253 . ApJL , 498 pp. L115, May 1998.
- [brunthaler_evidence_2009] A. Brunthaler, P. Castangia, A. Tarchi, C. Henkel, M. J. Reid, H. Falcke, and K. M. Menten. Evidence of a pure starburst nature of the nuclear region of NGC 253 . A&A , 497 pp. 103–108, April 2009.
- [dale_spitzer_2009] D. A. Dale, J. D. T. Smith, E. A. Schlawin, L. Armus, B. A. Buckalew, S. A. Cohen, G. Helou, T. H. Jarrett, L. C. Johnson, J. Moustakas, E. J. Murphy, H. Roussel, K. Sheth, S. Staudaher, C. Bot, D. Calzetti, C. W. Engelbracht, K. D. Gordon, D. J. Hollenbach, R. C. Kennicutt, and S. Malhotra. The spitzer infrared nearby galaxies survey: A high-resolution spectroscopy anthology . ApJ , 693 pp. 1821–1834, March 2009.
- [devost_spitzer_2004] Daniel Devost, Bernhard R. Brandl, L. Armus, D. J. Barry, G. C. Sloan, Vassilis Charmandaris, Henrik Spoon, Jeronimo Bernard-Salas, and James R. Houck. Spitzer infrared spectrograph (IRS) mapping of the inner kiloparsec of NGC 253: Spatial distribution of the [ne III], polycyclic aromatic hydrocarbon 11.3 micron, and h2 (0-0) s(1) lines and a gradient in the [ne III]/[Ne II] line ratio . ApJS , 154 pp. 242–247, September 2004.
- [dudley_8-13_1999] C. C. Dudley and C. G. Wynn-Williams. 8-13 μm spectroscopy of NGC 253: a spatially resolved starburst . MNRAS , 304 pp. 549–556, April 1999.
- [engelbracht_nuclear_1998] C. W. Engelbracht, M. J. Rieke, G. H. Rieke, D. M. Kelly, and J. M. Achtermann. The nuclear starburst in NGC 253 . ApJ , 505 pp. 639–658, October 1998.
- [fernandez-ontiveros_nucleus_2009] J. A. Fernández-Ontiveros, M. A. Prieto, and J. A. Acosta-Pulido. The nucleus of NGC 253 and its massive stellar clusters at parsec scales . MNRAS , 392 pp. L16–L20, January 2009.
- [forster_schreiber_isocam_2003] N. M. Förster Schreiber, M. Sauvage, V. Charmandaris, O. Laurent, P. Gallais, I. F. Mirabel, and L. Vigroux. ISOCAM view of the starburst galaxies m 82, NGC 253 and NGC 1808 . A&A , 399 pp. 833–855, March 2003.
- [galliano_mid-infrared_2005] E. Galliano, D. Alloin, E. Pantin, P. O. Lagage, and O. Marco. Mid-infrared imaging of active galaxies. active nuclei and embedded star clusters . A&A , 438 pp. 803–820, August 2005.
- [gillett_observations_1975] F. C. Gillett, D. E. Kleinmann, E. L. Wright, and R. W. Capps. Observations of m82 and NGC 253 at 8-13 microns . ApJL , 198 pp. L65–L68, June 1975.
- [goulding_towards_2009] A. D. Goulding and D. M. Alexander. Towards a complete census of AGN in nearby galaxies: a large population of optically unidentified AGN . MNRAS , 398 pp. 1165–1193, September 2009.
- [ho_excess_1989] Paul T. P. Ho, Jean L. Turner, Giovanni G. Fazio, and S. P. Willner. Excess 10 micron emission in extragalactic nuclei . ApJ , 344 pp. 135–145, September 1989.
- [keto_mid-infrared_1993] Eric Keto, Roger Ball, John Arens, Garrett Jernigan, Margaret Meixner, Christopher Skinner, and James Graham. The mid-infrared radio correlation at high angular resolution - NGC 253 . ApJL , 413 pp. L23–L26, August 1993.
- [keto_super-star_1999] Eric Keto, Joseph L. Hora, G. G. Fazio, William Hoffmann, and Lynne Deutsch. A super-star cluster in NGC 253: Mid-infrared properties . ApJ , 518 pp. 183–189, June 1999.
- [mohan_very_2002] Niruj R. Mohan, K. R. Anantharamaiah, and W. M. Goss. Very large array detection of radio recombination lines from the radio nucleus of NGC 253: Ionization by a weak active galactic nucleus, an obscured super star cluster, or a compact supernova remnant? . ApJ , 574 pp. 701–708, August 2002.
- [muller-sanchez_stellar_2010] F. Müller-Sánchez, O. González-Martín, J. A. Fernández-Ontiveros, J. A. Acosta-Pulido, and M. A. Prieto. The stellar kinematic center and the true galactic nucleus of NGC 253 . ApJ , 716 pp. 1166–1177, June 2010.
- [pina_12_1992] R. K. Pina, B. Jones, R. C. Puetter, and W. A. Stein. 12 and 20 micron imaging of the starburst galaxy NGC 253 . ApJL , 401 pp. L75–L78, December 1992.
- [raban_core_2008] D. Raban, B. Heijligers, H. Röttgering, K. Meisenheimer, W. Jaffe, H. U. Käufl, and T. Henning. The core flux of the brightest 10 μm galaxies in the southern sky . A&A , 484 pp. 341–345, June 2008.
- [rieke_10_1978] G. H. Rieke and M. J. Lebofsky. 10 micron observations of bright galaxies . ApJL , 220 pp. L37–L41, March 1978.
- [rieke_nucleus_1975] G. H. Rieke and F. J. Low. The nucleus of NGC 253 . ApJ , 197 pp. 17–23, April 1975.
- [rigopoulou_large_1999] D. Rigopoulou, H. W. W. Spoon, R. Genzel, D. Lutz, A. F. M. Moorwood, and Q. D. Tran. A large mid-infrared spectroscopic and near-infrared imaging survey of ultraluminous infrared galaxies: Their nature and evolution . AJ , 118 pp. 2625–2645, December 1999.
- [roche_8-13-micron_1985] P. F. Roche and D. K. Aitken. 8-13-MICRON spectrophotometry of galaxies - part five - the nuclei of five spiral galaxies . MNRAS , 213 pp. 789, April 1985.
- [sturm_iso-sws_2000] E. Sturm, D. Lutz, D. Tran, H. Feuchtgruber, R. Genzel, D. Kunze, A. F. M. Moorwood, and M. D. Thornley. ISO-SWS spectra of galaxies: Continuum and features . A&A , 358 pp. 481–493, June 2000.
- [tadhunter_optical_1993] C. N. Tadhunter, R. Morganti, S. di Serego-Alighieri, R. A. E. Fosbury, and I. J. Danziger. Optical spectroscopy of a complete sample of southern 2-JY radio sources . MNRAS , 263 pp. 999, August 1993.
- [telesco_genesis_1993] C. M. Telesco, L. L. Dressel, and R. D. Wolstencroft. The genesis of starbursts and infrared emission in the centers of galaxies . ApJ , 414 pp. 120–143, September 1993.
- [tristram_parsec-scale_2009] K. R. W. Tristram, D. Raban, K. Meisenheimer, W. Jaffe, H. Röttgering, L. Burtscher, W. D. Cotton, U. Graser, Th. Henning, Ch. Leinert, B. Lopez, S. Morel, G. Perrin, and M. Wittkowski. Parsec-scale dust distributions in seyfert galaxies. results of the MIDI AGN snapshot survey . A&A , 502 pp. 67–84, July 2009.
- [turner_1_1985] J. L. Turner and P. T. P. Ho. The 1 parsec radio core and possible nuclear ejection in NGC 253 . ApJL , 299 pp. L77–L81, December 1985.
- [weaver_chandra_2002] K. A. Weaver, T. M. Heckman, D. K. Strickland, and M. Dahlem. Chandra observations of the evolving core of the starburst galaxy NGC 253 . ApJ , 576 pp. L19–L23, September 2002.
Images
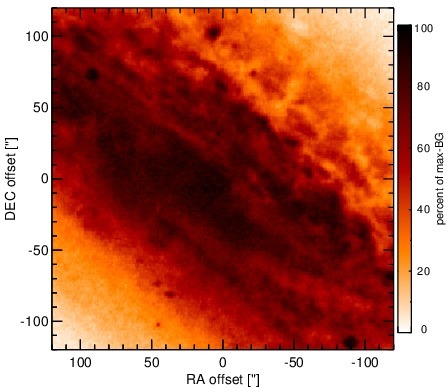
Optical image (DSS, red filter). Displayed are the central 4 arcmin with North being up and East to the left. The colour scaling is linear with white corresponding to the median background (BG) and black to the 0.01% pixels with the highest intensity.
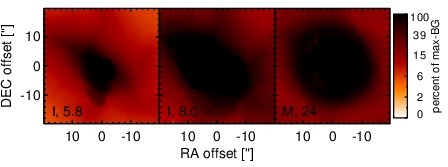
Spitzer MIR images. Displayed are the inner 40 arcsec with North being up and East to the left. The colour scaling is logarithmic with white corresponding to median BG and black to the 0.1% pixels with the highest intensity. The label in the bottom left states instrument and central wavelength of the filter in micron (I: IRAC, M: MIPS).
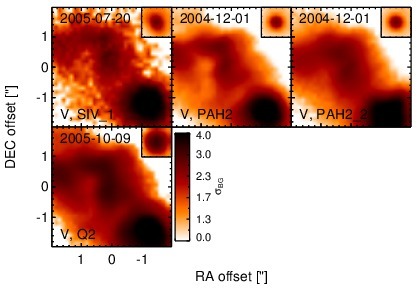
Subarcsecond-resolution MIR images sorted by increasing filter central wavelength. Displayed are the inner 4 arcsec with North being up and East to the left. The colour scaling is logarithmic with white corresponding to median BG and black to the 75% of the highest intensity of all images in units of sig_bg. The inset image (where present; either bottom or top right) shows the central arcsecond of the PSF from the calibrator star, scaled to match the science target. The labels in the bottom left state instrument and filter names (C: COMICS, M: Michelle, T: T-ReCS, V: VISIR).
SEDs
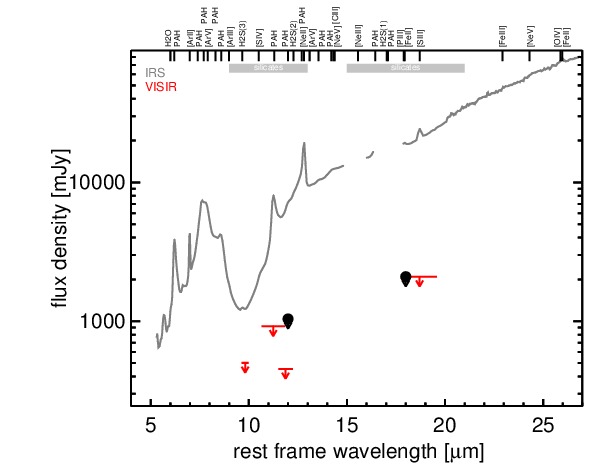
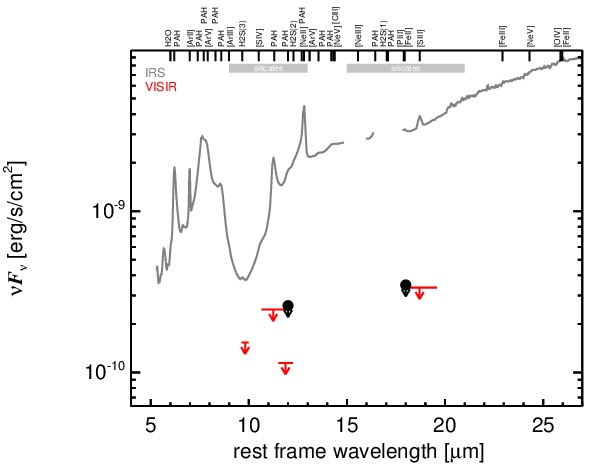
MIR SED. The description of the symbols in all the SED plots (where present) is the following: Grey crosses and solid lines mark the Spitzer/IRAC, MIPS and IRS data. The colour coding of the other symbols is as follows: green for COMICS, magenta for Michelle, blue for T-ReCS and red for VISIR data. Darker-coloured solid lines mark spectra of the corresponding instrument. The black filled circles mark the nuclear 12 and 18 micron continuum emission estimate from the data (where present). The ticks on the top axis mark positions of common MIR emission lines, while the light grey horizontal bars mark wavelength ranges affected by the silicate 10 and 18 micron features.