Sasmirala Individual Information for NGC 2623
Description
NGC 2623 is an infrared-luminous advanced merger system at a redshift of z = 0.0185 (D ~ 87.3 Mpc) with only one identified nucleus (see [evans_off-nuclear_2008] for a recent multiwavelength study of the system). An AGN was detected at X-ray and radio wavelengths inside the compact central starburst [maiolino_elusive_2003, lonsdale_starburst-agn_1993] but is optically ”elusive” with a spectral properties similar to NGC 4945 [maiolino_elusive_2003]. It has also been classified as a LINER or AGN/starburst composite (e.g., [lipari_infrared_2004]). In addition, the detection of [Ne V] provides further evidence for an AGN in NGC 2623 [dudik_mid-infrared_2007]. After the discovery of its MIR brightness through IRAS, NGC 2623 was observed by [carico_iras_1988], [wright_recent_1988], [wynn-williams_luminous_1993], [bushouse_distribution_1998], and [dudley_new_1999]. The first subarcsecond-resolution N-band images were made with Keck/LWS [soifer_high-resolution_2001] where a marginally resolved MIR nucleus with east-west elongation coinciding with the radio morphology was detected (major axis~ 2arcsec ~ 0.8 kpc; PA~ 90∘). In the Spitzer/IRAC and MIPS images, NGC 2623 appears a compact MIR nucleus with faint host emission, which becomes weaker towards longer wavelengths. Our nuclear IRAC 5.8 and 8.0 μm and MIPS 24 μm fluxes agree in general with the values by [u_spectral_2012]. The IRS LR staring-mode spectrum exhibits deep silicate 10 μm and possible silicate 18 μm absorption features, prominent PAH emission and a steep red spectral slope in νFν-space (see also [brandl_mid-infrared_2006, bernard-salas_spitzer_2009]). NGC 2623 was observed with COMICS in the Q17.7 filter in 2008 [imanishi_subaru_2011] and a marginally resolved MIR nucleus was detected (~ 1arcsec ~ 0.4 kpc) but with a position angle of ~ 50∘. Because this is inconsistent with the previous Keck/LWS images, we classify NGC 2623 as possibly extended only. Our remeasured nuclear Q17.7 flux is significantly higher than the value by [imanishi_subaru_2011] but consistent with the Spitzer spectrophotometry and the Keck/LWS data. Therefore, we use the IRS spectrum to calculate the 12 μm continuum emission estimate corrected for the silicate feature. Note however, that the nuclear fluxes would be significantly lower if the presence of subarcsecond-extended emission can be verified. Owing to the presence of PAH emission in the IRS spectrum and the object distance, the subarcsecond MIR values of NGC 2623 are presumably heavily star-formation contaminated.
- [bernard-salas_spitzer_2009] J. Bernard-Salas, H. W. W. Spoon, V. Charmandaris, V. Lebouteiller, D. Farrah, D. Devost, B. R. Brandl, Yanling Wu, L. Armus, L. Hao, G. C. Sloan, D. Weedman, and J. R. Houck. A spitzer high-resolution mid-infrared spectral atlas of starburst galaxies . ApJS , 184 pp. 230–247, October 2009.
- [brandl_mid-infrared_2006] B. R. Brandl, J. Bernard-Salas, H. W. W. Spoon, D. Devost, G. C. Sloan, S. Guilles, Y. Wu, J. R. Houck, D. W. Weedman, L. Armus, P. N. Appleton, B. T. Soifer, V. Charmandaris, L. Hao, J. A. Marshall Higdon, and T. L. Herter. The mid-infrared properties of starburst galaxies from spitzer-IRS spectroscopy . ApJ , 653 pp. 1129–1144, December 2006.
- [bushouse_distribution_1998] Howard A. Bushouse, C. M. Telesco, and Michael W. Werner. The distribution of mid- and far-infrared emission in 10 interacting galaxy systems . AJ , 115 pp. 938–946, March 1998.
- [carico_iras_1988] David P. Carico, D. B. Sanders, B. T. Soifer, J. H. Elias, K. Matthews, and G. Neugebauer. The IRAS bright galaxy sample. III - 1-10 micron observations and coadded IRAS data for galaxies with l(IR) equal to or greater than 10 to the 11th solar luminosities . AJ , 95 pp. 356–373, February 1988.
- [dudik_mid-infrared_2007] R. P. Dudik, J. C. Weingartner, S. Satyapal, Jacqueline Fischer, C. C. Dudley, and B. O'Halloran. Mid-infrared fine-structure line ratios in active galactic nuclei observed with the spitzer IRS: evidence for extinction by the torus . ApJ , 664 pp. 71–87, July 2007.
- [dudley_new_1999] C. C. Dudley. New 8-13mum spectroscopy of luminous and ultraluminous infrared galaxies . MNRAS , 307 pp. 553–576, August 1999.
- [evans_off-nuclear_2008] A. S. Evans, T. Vavilkin, J. Pizagno, F. Modica, J. M. Mazzarella, K. Iwasawa, J. H. Howell, J. A. Surace, L. Armus, A. O. Petric, H. W. W. Spoon, J. E. Barnes, T. A. Suer, D. B. Sanders, B. Chan, and S. Lord. Off-nuclear star formation and obscured activity in the luminous infrared galaxy NGC 2623 . ApJL , 675 pp. L69–L72, March 2008.
- [imanishi_subaru_2011] Masatoshi Imanishi, Keisuke Imase, Nagisa Oi, and Kohei Ichikawa. Subaru and gemini high spatial resolution infrared 18 μm imaging observations of nearby luminous infrared galaxies . AJ , 141 pp. 156, May 2011.
- [lipari_infrared_2004] S. Lípari, E. Mediavilla, R. J. Díaz, B. García-Lorenzo, J. Acosta-Pulido, M. P. Agüero, and R. Terlevich. Infrared mergers and infrared quasi-stellar objects with galactic winds - i. NGC 2623: nuclear outflow in a proto-elliptical candidate . MNRAS , 348 pp. 369–394, February 2004.
- [lonsdale_starburst-agn_1993] Colin J. Lonsdale, Harding J. Smith, and Carol J. Lonsdale. The starburst-AGN connection - a sensitive VLBI survey of luminous IRAS galaxies . ApJL , 405 pp. L9–L12, March 1993.
- [maiolino_elusive_2003] R. Maiolino, A. Comastri, R. Gilli, N. M. Nagar, S. Bianchi, T. Böker, E. Colbert, A. Krabbe, A. Marconi, G. Matt, and M. Salvati. Elusive active galactic nuclei . MNRAS , 344 pp. L59–L64, October 2003.
- [soifer_high-resolution_2001] B. T. Soifer, G. Neugebauer, K. Matthews, E. Egami, A. J. Weinberger, M. Ressler, N. Z. Scoville, S. R. Stolovy, J. J. Condon, and E. E. Becklin. High-resolution mid-infrared imaging of infrared-luminous starburst galaxies . AJ , 122 pp. 1213–1237, September 2001.
- [u_spectral_2012] Vivian U, D. B. Sanders, J. M. Mazzarella, A. S. Evans, J. H. Howell, J. A. Surace, L. Armus, K. Iwasawa, D.-C. Kim, C. M. Casey, T. Vavilkin, M. Dufault, K. L. Larson, J. E. Barnes, B. H. P. Chan, D. T. Frayer, S. Haan, H. Inami, C. M. Ishida, J. S. Kartaltepe, J. L. Melbourne, and A. O. Petric. Spectral energy distributions of local luminous and ultraluminous infrared galaxies . ApJS , 203 pp. 9, November 2012.
- [wright_recent_1988] G. S. Wright, R. D. Joseph, N. A. Robertson, P. A. James, and W. P. S. Meikle. Recent star formation in interacting galaxies. III - evidence from mid-infrared photometry . MNRAS , 233 pp. 1–23, July 1988.
- [wynn-williams_luminous_1993] C. G. Wynn-Williams and E. E. Becklin. Luminous infrared galaxies - sizes at 10-32 microns . ApJ , 412 pp. 535–540, August 1993.
Images
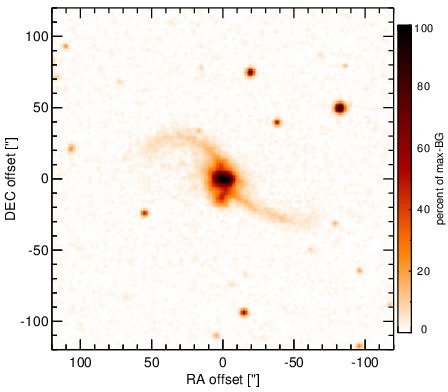
Optical image (DSS, red filter). Displayed are the central 4 arcmin with North being up and East to the left. The colour scaling is linear with white corresponding to the median background (BG) and black to the 0.01% pixels with the highest intensity.
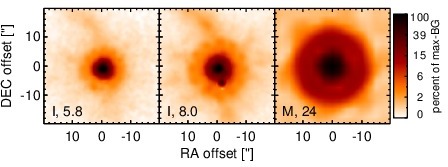
Spitzer MIR images. Displayed are the inner 40 arcsec with North being up and East to the left. The colour scaling is logarithmic with white corresponding to median BG and black to the 0.1% pixels with the highest intensity. The label in the bottom left states instrument and central wavelength of the filter in micron (I: IRAC, M: MIPS).
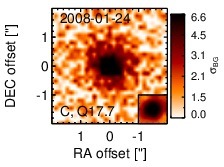
Subarcsecond-resolution MIR images sorted by increasing filter central wavelength. Displayed are the inner 4 arcsec with North being up and East to the left. The colour scaling is logarithmic with white corresponding to median BG and black to the 75% of the highest intensity of all images in units of sig_bg. The inset image (where present; either bottom or top right) shows the central arcsecond of the PSF from the calibrator star, scaled to match the science target. The labels in the bottom left state instrument and filter names (C: COMICS, M: Michelle, T: T-ReCS, V: VISIR).
SEDs
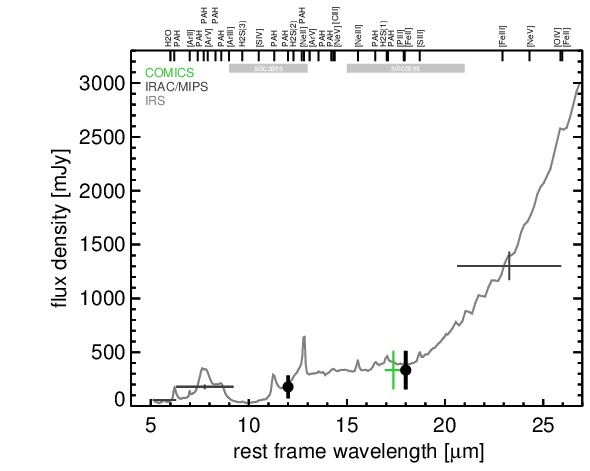
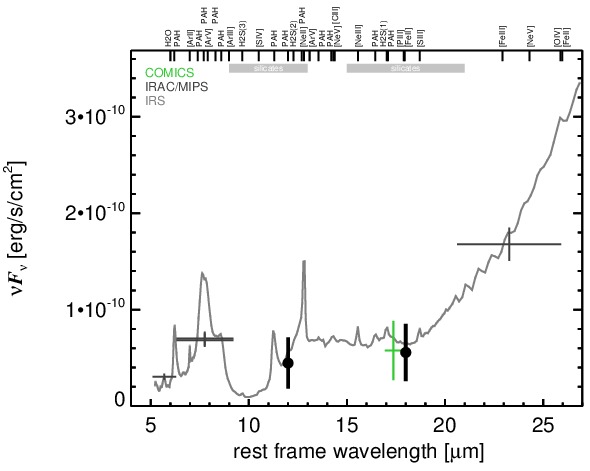
MIR SED. The description of the symbols in all the SED plots (where present) is the following: Grey crosses and solid lines mark the Spitzer/IRAC, MIPS and IRS data. The colour coding of the other symbols is as follows: green for COMICS, magenta for Michelle, blue for T-ReCS and red for VISIR data. Darker-coloured solid lines mark spectra of the corresponding instrument. The black filled circles mark the nuclear 12 and 18 micron continuum emission estimate from the data (where present). The ticks on the top axis mark positions of common MIR emission lines, while the light grey horizontal bars mark wavelength ranges affected by the silicate 10 and 18 micron features.