Sasmirala Individual Information for NGC 3081
Description
NGC 3081 is a low-inclination barred spiral galaxy at a redshift of z = 0.008 (D ~ 40.9 Mpc) with a Sy 2 nucleus [phillips_nearby_1983, durret_narrow_1986] with polarized broad emission lines [moran_frequency_2000]. It is an X-ray “buried” AGN candidate [eguchi_suzaku_2011] and belongs to the nine-month BAT AGN sample. The AGN very compact in radio possibly elongated with PA~ 164∘; [nagar_radio_1999] and possesses a biconical NLR extending ~ 4arcsec ~ 780 pc along a similar PA [ferruit_hubble_2000]. The first N-band observations were performed by [krabbe_n-band_2001] who report a point-like MIR nucleus without any host emission being detected. In the Spitzer/IRAC and MIPS images, the compact nucleus is embedded within weak lenticular host emission (north-south direction) and surrounded by a large-scale ring, which becomes increasingly prominent with increasing wavelength. The Spitzer/IRS LR staring-mode spectrum exhibits possible weak silicate 10 μm absorption, weak PAH emission, prominent forbidden emission lines and an emission peak at ~ 17 μm in νFν-space (see also [shi_9.7_2006, deo_mid-infrared_2009, weaver_mid-infrared_2010]). Thus, the arcsecond-scale MIR SED seems to contain only minor star formation contribution. NGC 3081 was observed with T-ReCS in the Si2 and Qa filters in 2006 [ramos_almeida_infrared_2009] and with VISIR in four narrow N-band filters in 2007, two of which a published in [gandhi_resolving_2009]. A compact MIR nucleus was detected in all images albeit with low S/N in most VISIR images, while extended biconical emission is visible in the Qa image (diameter~ 2arcsec ~ 400 pc; PA~ 170∘). This extended emission is consistent with the radio and NLR structures. Owing to the low S/N, it remains uncertain, whether this structure is present also at shorter wavelengths. Note that extended emission might also be present in the Si2 image but with a different PA. Our T-ReCS nuclear photometry is consistent with [ramos_almeida_infrared_2009], while this is not the case for the VISIR fluxes compared to [gandhi_resolving_2009], which is caused by our improved measurement technique for faint detections. In addition, our photometry agrees with the T-ReCS LR N-band spectrum published by [gonzalez-martin_dust_2013] well and is on average ~ 39% lower than the Spitzer spectrophotometry. Note that the T-ReCS spectrum does not exhibit any PAH emission, which indicates that at subarcsecond resolution, we are probing the pure AGN-related MIR emission of NGC 3081.
- [deo_mid-infrared_2009] Rajesh P. Deo, Gordon T. Richards, D. M. Crenshaw, and S. B. Kraemer. The mid-infrared continua of seyfert galaxies . ApJ , 705 pp. 14–31, November 2009.
- [durret_narrow_1986] F. Durret and J. Bergeron. The narrow line active galaxies NGC 3081 and NGC 4507 - from the infrared to the UV . A&A , 156 pp. 51–63, February 1986.
- [eguchi_suzaku_2011] Satoshi Eguchi, Yoshihiro Ueda, Hisamitsu Awaki, James Aird, Yuichi Terashima, and Richard Mushotzky. Suzaku view of the Swift/BAT active galactic nuclei. III. application of numerical torus models to two nearly compton thick active galactic nuclei (NGC 612 and NGC 3081) . ApJ , 729 pp. 31, March 2011.
- [ferruit_hubble_2000] Pierre Ferruit, Andrew S. Wilson, and John Mulchaey. Hubble space telescope WFPC2 imaging of a sample of early-type seyfert galaxies . ApJS , 128 pp. 139–169, May 2000.
- [gandhi_resolving_2009] P. Gandhi, H. Horst, A. Smette, S. Hönig, A. Comastri, R. Gilli, C. Vignali, and W. Duschl. Resolving the mid-infrared cores of local seyferts . A&A , 502 pp. 457–472, August 2009.
- [gonzalez-martin_dust_2013] O. González-Martín, J. M. Rodríguez-Espinosa, T. Díaz-Santos, C. Packham, A. Alonso-Herrero, P. Esquej, C. Ramos Almeida, R. Mason, and C. Telesco. Dust in active galactic nuclei. mid-infrared t-ReCS/Gemini spectra using the new RedCan pipeline . A&A , 553 pp. 35, May 2013.
- [krabbe_n-band_2001] Alfred Krabbe, Torsten Böker, and Roberto Maiolino. N-band imaging of seyfert nuclei and the mid-infrared-x-ray correlation . ApJ , 557 pp. 626–636, August 2001.
- [moran_frequency_2000] Edward C. Moran, Aaron J. Barth, Laura E. Kay, and Alexei V. Filippenko. The frequency of polarized broad emission lines in type 2 seyfert galaxies . ApJL , 540 pp. L73–L77, September 2000.
- [nagar_radio_1999] Neil M. Nagar, Andrew S. Wilson, John S. Mulchaey, and Jack F. Gallimore. Radio structures of seyfert galaxies. VIII. a distance- and magnitude-limited sample of early-type galaxies . ApJS , 120 pp. 209–245, February 1999.
- [phillips_nearby_1983] M. M. Phillips, P. A. Charles, and J. A. Baldwin. Nearby galaxies with seyfert-like nuclei . ApJ , 266 pp. 485–501, March 1983.
- [ramos_almeida_infrared_2009] C. Ramos Almeida, N. A. Levenson, J. M. Rodríguez Espinosa, A. Alonso-Herrero, A. Asensio Ramos, J. T. Radomski, C. Packham, R. S. Fisher, and C. M. Telesco. The infrared nuclear emission of seyfert galaxies on parsec scales: Testing the clumpy torus models . ApJ , 702 pp. 1127–1149, September 2009.
- [shi_9.7_2006] Y. Shi, G. H. Rieke, D. C. Hines, V. Gorjian, M. W. Werner, K. Cleary, F. J. Low, P. S. Smith, and J. Bouwman. 9.7 μm silicate features in active galactic nuclei: New insights into unification models . ApJ , 653 pp. 127–136, December 2006.
- [weaver_mid-infrared_2010] K. A. Weaver, M. Meléndez, R. F. Mushotzky, S. Kraemer, K. Engle, E. Malumuth, J. Tueller, C. Markwardt, C. T. Berghea, R. P. Dudik, L. M. Winter, and L. Armus. Mid-infrared properties of the swift burst alert telescope active galactic nuclei sample of the local universe. i. emission-line diagnostics . ApJ , 716 pp. 1151–1165, June 2010.
Images
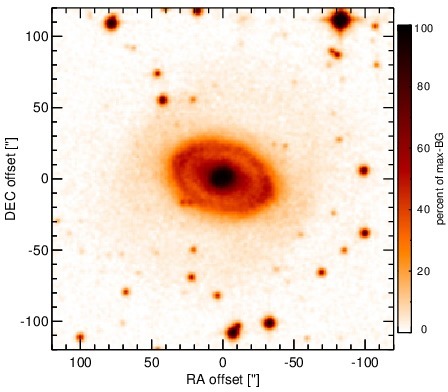
Optical image (DSS, red filter). Displayed are the central 4 arcmin with North being up and East to the left. The colour scaling is linear with white corresponding to the median background (BG) and black to the 0.01% pixels with the highest intensity.
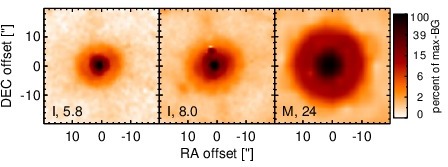
Spitzer MIR images. Displayed are the inner 40 arcsec with North being up and East to the left. The colour scaling is logarithmic with white corresponding to median BG and black to the 0.1% pixels with the highest intensity. The label in the bottom left states instrument and central wavelength of the filter in micron (I: IRAC, M: MIPS).
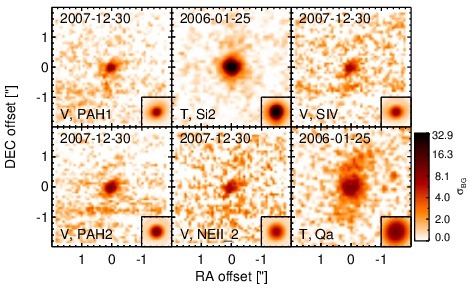
Subarcsecond-resolution MIR images sorted by increasing filter central wavelength. Displayed are the inner 4 arcsec with North being up and East to the left. The colour scaling is logarithmic with white corresponding to median BG and black to the 75% of the highest intensity of all images in units of sig_bg. The inset image (where present; either bottom or top right) shows the central arcsecond of the PSF from the calibrator star, scaled to match the science target. The labels in the bottom left state instrument and filter names (C: COMICS, M: Michelle, T: T-ReCS, V: VISIR).
SEDs
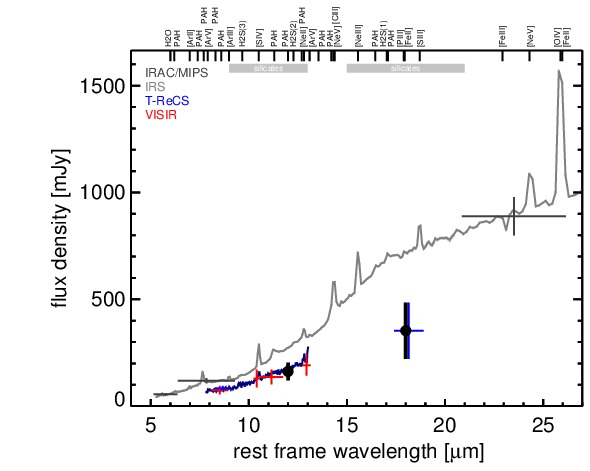
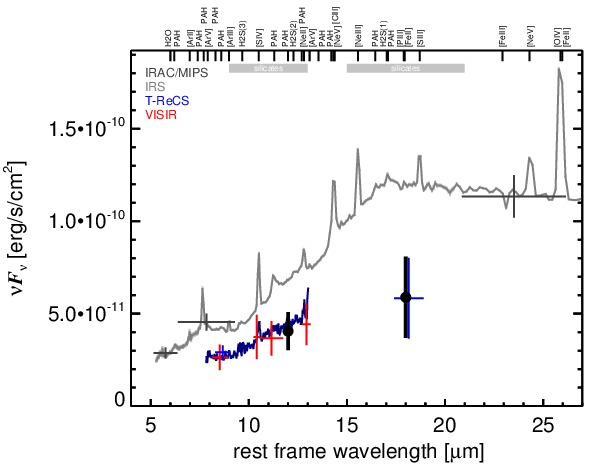
MIR SED. The description of the symbols in all the SED plots (where present) is the following: Grey crosses and solid lines mark the Spitzer/IRAC, MIPS and IRS data. The colour coding of the other symbols is as follows: green for COMICS, magenta for Michelle, blue for T-ReCS and red for VISIR data. Darker-coloured solid lines mark spectra of the corresponding instrument. The black filled circles mark the nuclear 12 and 18 micron continuum emission estimate from the data (where present). The ticks on the top axis mark positions of common MIR emission lines, while the light grey horizontal bars mark wavelength ranges affected by the silicate 10 and 18 micron features.