Sasmirala Individual Information for NGC 3368
Description
NGC 3368 is a low-inclination spiral galaxy at a distance of D = 10.6 ± 1.6 Mpc (NED redshift-independent median) with an active nucleus optically classified as a LINER [ho_search_1997-1]. No compact radio core could be detect in the centre of this galaxy [nagar_radio_2002], although a compact UV and X-ray source was detected [satyapal_joint_2004, chiaberge_hubble_2005, maoz_murmur_2005]. The first N-band photometry of NGC 3368 was obtained with IRTF [cizdziel_multiaperture_1985]. The Spitzer/IRAC and MIPS images show an extended nucleus embedded within the spiral-like host emission. We measure the nuclear component in the IRAC 5.8 and 8.0 μm and MIPS 24 μm images, which provides significantly lower values than the ones published in [dudik_spitzer_2009]. The IRS HR staring-mode PBCD spectrum is not very reliable owing to the complex MIR morphology of NGC 3368 but matches the nuclear IRAC photometry. Note also that no background subtraction was performed for this spectrum. It exhibits strong PAH emission and weak silicate absorption typical for star formation (see also [goulding_towards_2009]). The nuclear region of NGC 3368 was imaged with VISIR in the PAH2_2 filter in 2010 (unpublished, to our knowledge). The nucleus has not been detected in the image and our derived upper limit is 90% lower than the Spitzer spectrophotometry. This indicates that star formation is dominating the nuclear MIR emission at ~ 200 pc scales.
- [chiaberge_hubble_2005] Marco Chiaberge, Alessandro Capetti, and F. Duccio Macchetto. The hubble space telescope view of LINER nuclei: Evidence for a dual population? . ApJ , 625 pp. 716–726, June 2005.
- [cizdziel_multiaperture_1985] P. J. Cizdziel, E. E. Becklin, and C. G. Wynn-Williams. Multiaperture infrared photometry of the nuclei of spiral galaxies . AJ , 90 pp. 731–735, May 1985.
- [dudik_spitzer_2009] R. P. Dudik, S. Satyapal, and D. Marcu. A spitzer spectroscopic survey of low-ionization nuclear emission-line regions: Characterization of the central source . ApJ , 691 pp. 1501–1524, February 2009.
- [goulding_towards_2009] A. D. Goulding and D. M. Alexander. Towards a complete census of AGN in nearby galaxies: a large population of optically unidentified AGN . MNRAS , 398 pp. 1165–1193, September 2009.
- [ho_search_1997-1] Luis C. Ho, Alexei V. Filippenko, and Wallace L. W. Sargent. A search for ``Dwarf'' seyfert nuclei. III. spectroscopic parameters and properties of the host galaxies . ApJS , 112 pp. 315, October 1997.
- [maoz_murmur_2005] Dan Maoz, Neil M. Nagar, Heino Falcke, and Andrew S. Wilson. The murmur of the sleeping black hole: Detection of nuclear ultraviolet variability in LINER galaxies . ApJ , 625 pp. 699–715, June 2005.
- [nagar_radio_2002] N. M. Nagar, H. Falcke, A. S. Wilson, and J. S. Ulvestad. Radio sources in low-luminosity active galactic nuclei. III. ``AGNs'' in a distance-limited sample of ``LLAGNs'' . A&A , 392 pp. 53–82, September 2002.
- [satyapal_joint_2004] S. Satyapal, R. M. Sambruna, and R. P. Dudik. A joint mid-infrared spectroscopic and x-ray imaging investigation of LINER galaxies . A&A , 414 pp. 825–838, February 2004.
Images
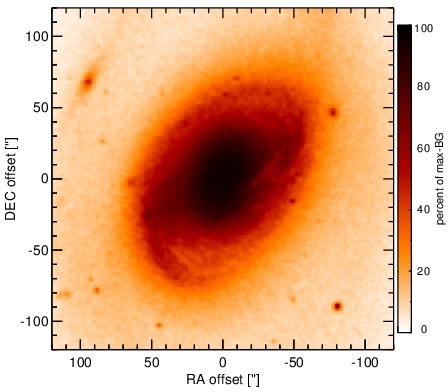
Optical image (DSS, red filter). Displayed are the central 4 arcmin with North being up and East to the left. The colour scaling is linear with white corresponding to the median background (BG) and black to the 0.01% pixels with the highest intensity.
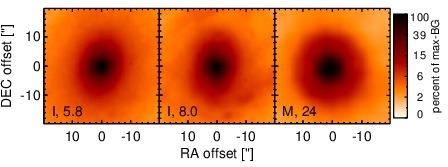
Spitzer MIR images. Displayed are the inner 40 arcsec with North being up and East to the left. The colour scaling is logarithmic with white corresponding to median BG and black to the 0.1% pixels with the highest intensity. The label in the bottom left states instrument and central wavelength of the filter in micron (I: IRAC, M: MIPS).
SEDs
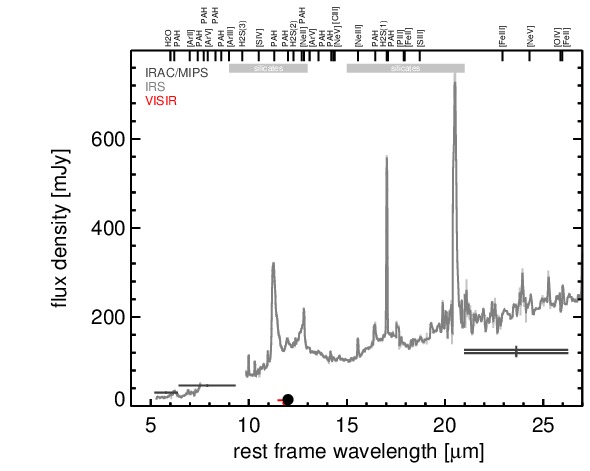
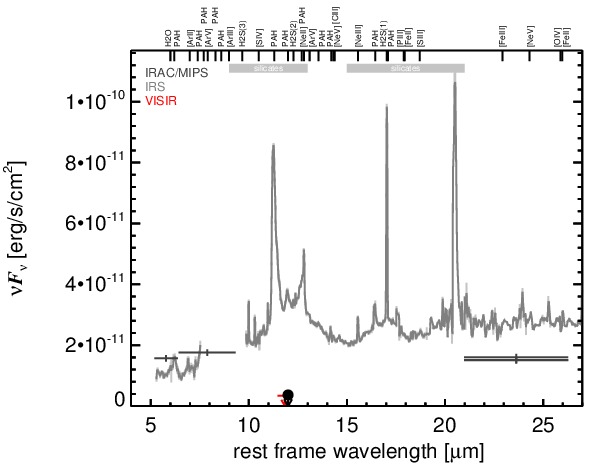
MIR SED. The description of the symbols in all the SED plots (where present) is the following: Grey crosses and solid lines mark the Spitzer/IRAC, MIPS and IRS data. The colour coding of the other symbols is as follows: green for COMICS, magenta for Michelle, blue for T-ReCS and red for VISIR data. Darker-coloured solid lines mark spectra of the corresponding instrument. The black filled circles mark the nuclear 12 and 18 micron continuum emission estimate from the data (where present). The ticks on the top axis mark positions of common MIR emission lines, while the light grey horizontal bars mark wavelength ranges affected by the silicate 10 and 18 micron features.