Sasmirala Individual Information for NGC 3379
Description
NGC 3379 is an elliptical galaxy at a distance of D = 10.6 ± 1.3 Mpc (NED redshift-independent median) with an active nucleus classified as a LINER/transition object [ho_search_1997-1]. An unresolved radio core was detected in the nucleus [wrobel_radio-continuum_1991] along with several X-ray point sources of comparable brightness [flohic_central_2006]. The first MIR observations of NGC 3379 were performed with IRTF in 1983 [impey_infrared_1986]. The IRAC and MIPS images show extended elliptical emission without a clearly separable nuclear component. However, we still measure the nuclear fluxes in the IRAC 5.8 and 8.0 μm and MIPS 24 μm images. Thus, our values are significantly lower than in the literature (e.g., [temi_spitzer_2009]). The IRS LR spectrum possesses only a low S/N but indicates silicate emission and a blue spectral slope in νFν-space but no PAH features, indicating the predominance of old stellar population emission (see also [bregman_ages_2006]). The nuclear region of NGC 3379 was observed with VISIR in the PAH1 filter in 2010 (unpublished, to our knowledge) but no compact nucleus could be detected. The derived upper limit is 87% lower than the Spitzer spectrophotometry. Therefore, host emission completely dominates the MIR even at the central ~ 200 pc of NGC 3379 and it remains unclear, whether an AGN is present at all.
- [bregman_ages_2006] Joel N. Bregman, Pasquale Temi, and Jesse D. Bregman. The ages of elliptical galaxies from infrared spectral energy distributions . ApJ , 647 pp. 265–275, August 2006.
- [flohic_central_2006] Hélène M. L. G. Flohic, Michael Eracleous, George Chartas, Joseph C. Shields, and Edward C. Moran. The central engines of 19 LINERs as viewed by chandra . ApJ , 647 pp. 140–160, August 2006.
- [ho_search_1997-1] Luis C. Ho, Alexei V. Filippenko, and Wallace L. W. Sargent. A search for ``Dwarf'' seyfert nuclei. III. spectroscopic parameters and properties of the host galaxies . ApJS , 112 pp. 315, October 1997.
- [impey_infrared_1986] C. D. Impey, C. G. Wynn-Williams, and E. E. Becklin. Infrared studies of elliptical galaxies. i - an optically selected sample . ApJ , 309 pp. 572–592, October 1986.
- [temi_spitzer_2009] Pasquale Temi, Fabrizio Brighenti, and William G. Mathews. Spitzer observations of passive and star-forming early-type galaxies: An infrared color-color sequence . ApJ , 707 pp. 890–902, December 2009.
- [wrobel_radio-continuum_1991] J. M. Wrobel and D. S. Heeschen. Radio-continuum sources in nearby and bright E/S0 galaxies - active nuclei versus star formation . AJ , 101 pp. 148–169, January 1991.
Images
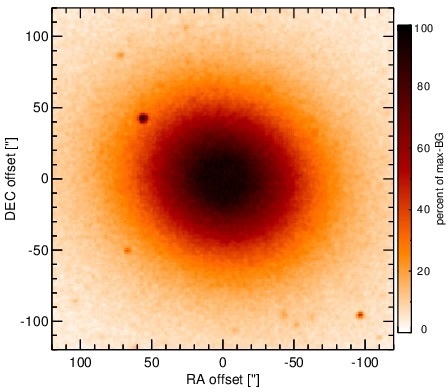
Optical image (DSS, red filter). Displayed are the central 4 arcmin with North being up and East to the left. The colour scaling is linear with white corresponding to the median background (BG) and black to the 0.01% pixels with the highest intensity.
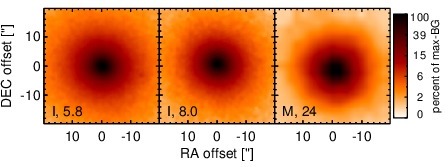
Spitzer MIR images. Displayed are the inner 40 arcsec with North being up and East to the left. The colour scaling is logarithmic with white corresponding to median BG and black to the 0.1% pixels with the highest intensity. The label in the bottom left states instrument and central wavelength of the filter in micron (I: IRAC, M: MIPS).
SEDs
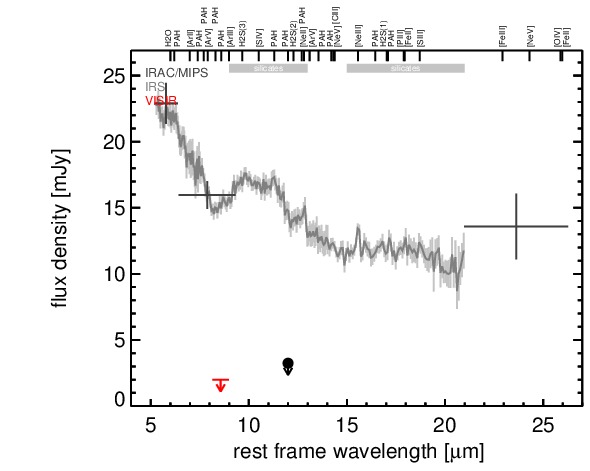
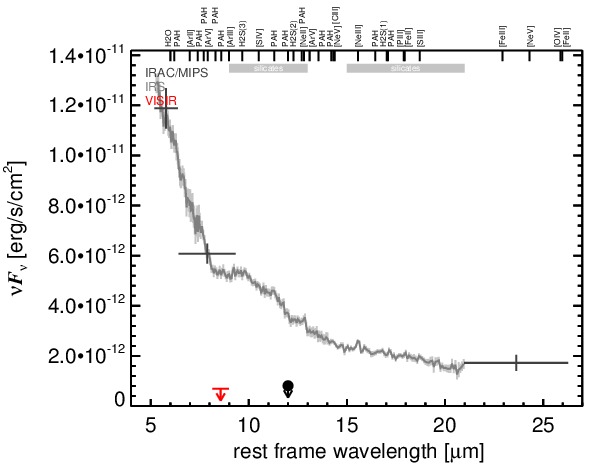
MIR SED. The description of the symbols in all the SED plots (where present) is the following: Grey crosses and solid lines mark the Spitzer/IRAC, MIPS and IRS data. The colour coding of the other symbols is as follows: green for COMICS, magenta for Michelle, blue for T-ReCS and red for VISIR data. Darker-coloured solid lines mark spectra of the corresponding instrument. The black filled circles mark the nuclear 12 and 18 micron continuum emission estimate from the data (where present). The ticks on the top axis mark positions of common MIR emission lines, while the light grey horizontal bars mark wavelength ranges affected by the silicate 10 and 18 micron features.