Sasmirala Individual Information for NGC 34
Description
NGC 34 is an infrared-luminous late-stage merger system (nuclei separation ~ 17arcsec;~ 6 kpc; PA~-30∘; see [schweizer_remnant_2007] for a detailed study) at a redshift of z = 0.0196 (D ~ 77 Mpc) with an active nucleus controversially classified either as a Sy 2 or H II [mazzarella_optical_1993]. The nucleus is resolved and bright at radio wavelengths (PA~ 125∘; [nagar_radio_1999]), while the [O III] emission is weak and rather decentralized favouring a non-AGN nucleus ([mulchaey_emission-line_1996]; see also [riffel_0.8-2.4_2006]). However, the most recent classification by [yuan_role_2010] is Sy 2 (see also [goncalves_agns_1999]), while X-ray observations revealed the presence of a Compton-thick obscured AGN [shu_investigating_2007], which might explain the previous contradicting results. In addition, a nuclear disc-like water maser was detected [greenhill_discovery_2009]. After the discovery of its infrared brightness, NGC 34 was observed with ground-based MIR instruments [carico_iras_1988, keto_high_1991, maiolino_new_1995], and first subarcsecond-resolution N-band images were obtained with Palomar 5 m/SpectroCam-10 [miles_high-resolution_1996], followed by Palomar 5 m/MIRLIN [gorjian_10_2004]. In these images, a compact MIR nucleus with emission extending ~ 1.2arcsec ~ 430 pc to the south was detected, while the nuclear emission is also extended in the Spitzer/IRAC and MIPS images (PA~ 0∘). Because we measure the nuclear component only, our IRAC 5.8 and 8.0 μm fluxes are significantly lower compared to the values in [gallimore_infrared_2010]. The IRS LR mapping-mode spectrum appears to be dominated by star formation with strong PAH features, silicate 10 μm absorption and a red steep spectral slope in νFν-space (see also [buchanan_spitzer_2006, wu_spitzer/irs_2009, gallimore_infrared_2010, tommasin_spitzer-irs_2010]). NGC 34 was observed with T-ReCS in the Si5 filter in 2008 (unpublished, to our knowledge). An extended elongated MIR nucleus consistent with the previous MIR observations was detected in the image (FWHM(major axis) ~ 0.71arcsec ~ 260 pc; PA~ 173∘). The unresolved nuclear Si5 flux is ~ 25% of the Spitzer spectrophotometry, while the total Si5 flux agrees with the latter. Therefore, we conclude that the MIR emission of NGC 34 is dominated by a nuclear starburst on 300 pc scales, while the AGN contributes only up to 25%.
- [buchanan_spitzer_2006] Catherine L. Buchanan, Jack F. Gallimore, Christopher P. O'Dea, Stefi A. Baum, David J. Axon, Andrew Robinson, Moshe Elitzur, and Martin Elvis. Spitzer IRS spectra of a large sample of seyfert galaxies: A variety of infrared spectral energy distributions in the local active galactic nucleus population . AJ , 132 pp. 401–419, July 2006.
- [carico_iras_1988] David P. Carico, D. B. Sanders, B. T. Soifer, J. H. Elias, K. Matthews, and G. Neugebauer. The IRAS bright galaxy sample. III - 1-10 micron observations and coadded IRAS data for galaxies with l(IR) equal to or greater than 10 to the 11th solar luminosities . AJ , 95 pp. 356–373, February 1988.
- [gallimore_infrared_2010] J. F. Gallimore, A. Yzaguirre, J. Jakoboski, M. J. Stevenosky, D. J. Axon, S. A. Baum, C. L. Buchanan, M. Elitzur, M. Elvis, C. P. O'Dea, and A. Robinson. Infrared spectral energy distributions of seyfert galaxies: Spitzer space telescope observations of the 12 μm sample of active galaxies . ApJS , 187 pp. 172–211, March 2010.
- [goncalves_agns_1999] A. C. Gonçalves, M.-P. Véron-Cetty, and P. Véron. AGNs with composite spectra. II. additional data . A&AS , 135 pp. 437–466, March 1999.
- [gorjian_10_2004] V. Gorjian, M. W. Werner, T. H. Jarrett, D. M. Cole, and M. E. Ressler. 10 micron imaging of seyfert galaxies from the 12 micron sample . ApJ , 605 pp. 156–167, April 2004.
- [greenhill_discovery_2009] Lincoln J. Greenhill, Paul T. Kondratko, James M. Moran, and Avanti Tilak. Discovery of candidate H2O disk masers in active galactic nuclei and estimations of centripetal accelerations . ApJ , 707 pp. 787–799, December 2009.
- [keto_high_1991] Eric Keto, Garrett Jernigan, John Arens, Margaret Meixner, and Roger Ball. High angular resolution broad-band imaging in the mid-infrared - the infrared bright galaxy NGC 34 . ApJL , 374 pp. L29–L31, June 1991.
- [maiolino_new_1995] R. Maiolino, M. Ruiz, G. H. Rieke, and L. D. Keller. New constraints on the unified model of seyfert galaxies . ApJ , 446 pp. 561, June 1995.
- [mazzarella_optical_1993] Joseph M. Mazzarella and Todd A. Boroson. Optical imaging and long-slit spectroscopy of markarian galaxies with multiple nuclei. i - basic data . ApJS , 85 pp. 27–109, March 1993.
- [miles_high-resolution_1996] J. W. Miles, J. R. Houck, T. L. Hayward, and M. L. N. Ashby. High-resolution mid-infrared imaging of infrared-luminous galaxies . ApJ , 465 pp. 191, July 1996.
- [mulchaey_emission-line_1996] John S. Mulchaey, Andrew S. Wilson, and Zlatan Tsvetanov. An emission-line imaging survey of early-type seyfert galaxies. i. the observations . ApJS , 102 pp. 309, February 1996.
- [nagar_radio_1999] Neil M. Nagar, Andrew S. Wilson, John S. Mulchaey, and Jack F. Gallimore. Radio structures of seyfert galaxies. VIII. a distance- and magnitude-limited sample of early-type galaxies . ApJS , 120 pp. 209–245, February 1999.
- [riffel_0.8-2.4_2006] R. Riffel, A. Rodríguez-Ardila, and M. G. Pastoriza. A 0.8-2.4 μm spectral atlas of active galactic nuclei . A&A , 457 pp. 61–70, October 2006.
- [schweizer_remnant_2007] François Schweizer and Patrick Seitzer. Remnant of a ``Wet'' merger: NGC 34 and its young massive clusters, young stellar disk, and strong gaseous outflow . AJ , 133 pp. 2132–2155, May 2007.
- [shu_investigating_2007] X. W. Shu, J. X. Wang, P. Jiang, L. L. Fan, and T. G. Wang. Investigating the nuclear obscuration in two types of seyfert 2 galaxies . ApJ , 657 pp. 167–176, March 2007.
- [tommasin_spitzer-irs_2010] Silvia Tommasin, Luigi Spinoglio, Matthew A. Malkan, and Giovanni Fazio. Spitzer-IRS high-resolution spectroscopy of the 12 μm seyfert galaxies. II. results for the complete data set . ApJ , 709 pp. 1257–1283, February 2010.
- [wu_spitzer/irs_2009] Yanling Wu, Vassilis Charmandaris, Jiasheng Huang, Luigi Spinoglio, and Silvia Tommasin. Spitzer/IRS 5-35 μm low-resolution spectroscopy of the 12 μm seyfert sample . ApJ , 701 pp. 658–676, August 2009.
- [yuan_role_2010] T.-T. Yuan, L. J. Kewley, and D. B. Sanders. The role of starburst-active galactic nucleus composites in luminous infrared galaxy mergers: Insights from the new optical classification scheme . ApJ , 709 pp. 884–911, February 2010.
Images
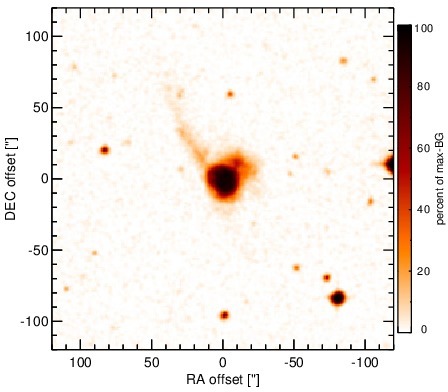
Optical image (DSS, red filter). Displayed are the central 4 arcmin with North being up and East to the left. The colour scaling is linear with white corresponding to the median background (BG) and black to the 0.01% pixels with the highest intensity.
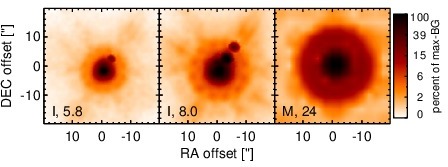
Spitzer MIR images. Displayed are the inner 40 arcsec with North being up and East to the left. The colour scaling is logarithmic with white corresponding to median BG and black to the 0.1% pixels with the highest intensity. The label in the bottom left states instrument and central wavelength of the filter in micron (I: IRAC, M: MIPS).
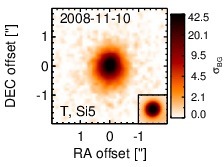
Subarcsecond-resolution MIR images sorted by increasing filter central wavelength. Displayed are the inner 4 arcsec with North being up and East to the left. The colour scaling is logarithmic with white corresponding to median BG and black to the 75% of the highest intensity of all images in units of sig_bg. The inset image (where present; either bottom or top right) shows the central arcsecond of the PSF from the calibrator star, scaled to match the science target. The labels in the bottom left state instrument and filter names (C: COMICS, M: Michelle, T: T-ReCS, V: VISIR).
SEDs
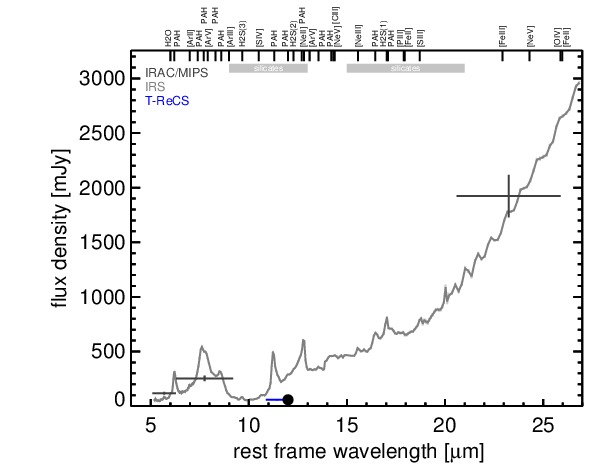
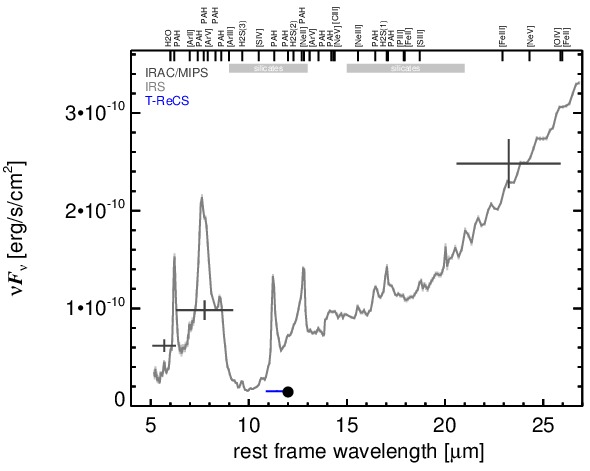
MIR SED. The description of the symbols in all the SED plots (where present) is the following: Grey crosses and solid lines mark the Spitzer/IRAC, MIPS and IRS data. The colour coding of the other symbols is as follows: green for COMICS, magenta for Michelle, blue for T-ReCS and red for VISIR data. Darker-coloured solid lines mark spectra of the corresponding instrument. The black filled circles mark the nuclear 12 and 18 micron continuum emission estimate from the data (where present). The ticks on the top axis mark positions of common MIR emission lines, while the light grey horizontal bars mark wavelength ranges affected by the silicate 10 and 18 micron features.