Sasmirala Individual Information for NGC 3521
Description
NGC 3521 is a nearby highly-inclined spiral galaxy at a distance of D = 11.5 ± 2.8 Mpc (NED redshift-independent median) with a little-studied active nucleus, classified optically as borderline H II/LINER [ho_search_1997-1]. A nuclear compact source was detected in X-rays [zhang_census_2009], while no subarcsecond-resolution radio observations have been published. The first observed in the MIR by [rieke_10_1978] but not detected, while [cizdziel_multiaperture_1985] report a marginal detection. The Spitzer/IRAC and MIPS images show an elongated nucleus embedded within diffuse host emission and surrounded by a large-scale ring. We measure the nuclear component resulting in flux much lower than the total fluxes in the literature (e.g., [dale_infrared_2005, marble_aromatic_2010]). The Spitzer/IRS LR staring-mode PBCD spectrum for this object is unreliable due to the complex MIR morphology but indicates significant PAH emission, i.e., star formation (see also [goulding_towards_2009, marble_aromatic_2010]). Note that [dudik_spitzer_2009] claim the detection of the AGN-indicative [Ne V] emission line, which however is inconsistent with the upper limit by [goulding_towards_2009] for this line. The nuclear region of NGC 3521 was observed with VISIR in the PAH2_2 filter in 2010 (unpublished, to our knowledge) but nothing was detected in the image. Our derived flux upper limit is ~ 80% lower than the flux levels of the Spitzer data. Therefore, there is no evidence for an AGN from the MIR point of view.
- [cizdziel_multiaperture_1985] P. J. Cizdziel, E. E. Becklin, and C. G. Wynn-Williams. Multiaperture infrared photometry of the nuclei of spiral galaxies . AJ , 90 pp. 731–735, May 1985.
- [dale_infrared_2005] D. A. Dale, G. J. Bendo, C. W. Engelbracht, K. D. Gordon, M. W. Regan, L. Armus, J. M. Cannon, D. Calzetti, B. T. Draine, G. Helou, R. D. Joseph, R. C. Kennicutt, A. Li, E. J. Murphy, H. Roussel, F. Walter, H. M. Hanson, D. J. Hollenbach, T. H. Jarrett, L. J. Kewley, C. A. Lamanna, C. Leitherer, M. J. Meyer, G. H. Rieke, M. J. Rieke, K. Sheth, J. D. T. Smith, and M. D. Thornley. Infrared spectral energy distributions of nearby galaxies . ApJ , 633 pp. 857–870, November 2005.
- [dudik_spitzer_2009] R. P. Dudik, S. Satyapal, and D. Marcu. A spitzer spectroscopic survey of low-ionization nuclear emission-line regions: Characterization of the central source . ApJ , 691 pp. 1501–1524, February 2009.
- [goulding_towards_2009] A. D. Goulding and D. M. Alexander. Towards a complete census of AGN in nearby galaxies: a large population of optically unidentified AGN . MNRAS , 398 pp. 1165–1193, September 2009.
- [ho_search_1997-1] Luis C. Ho, Alexei V. Filippenko, and Wallace L. W. Sargent. A search for ``Dwarf'' seyfert nuclei. III. spectroscopic parameters and properties of the host galaxies . ApJS , 112 pp. 315, October 1997.
- [marble_aromatic_2010] A. R. Marble, C. W. Engelbracht, L. van Zee, D. A. Dale, J. D. T. Smith, K. D. Gordon, Y. Wu, J. C. Lee, R. C. Kennicutt, E. D. Skillman, L. C. Johnson, M. Block, D. Calzetti, S. A. Cohen, H. Lee, and M. D. Schuster. An aromatic inventory of the local volume . ApJ , 715 pp. 506–540, May 2010.
- [rieke_10_1978] G. H. Rieke and M. J. Lebofsky. 10 micron observations of bright galaxies . ApJL , 220 pp. L37–L41, March 1978.
- [zhang_census_2009] Wei Ming Zhang, Roberto Soria, Shuang Nan Zhang, Douglas A. Swartz, and Ji Feng Liu. A census of x-ray nuclear activity in nearby galaxies . ApJ , 699 pp. 281–297, July 2009.
Images
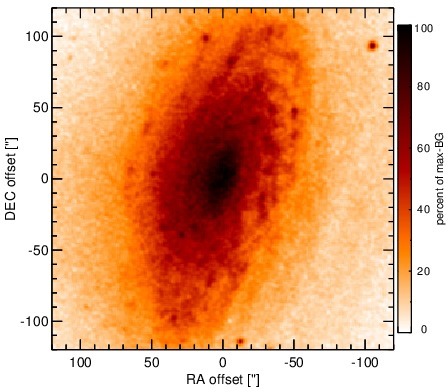
Optical image (DSS, red filter). Displayed are the central 4 arcmin with North being up and East to the left. The colour scaling is linear with white corresponding to the median background (BG) and black to the 0.01% pixels with the highest intensity.
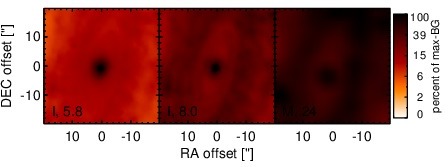
Spitzer MIR images. Displayed are the inner 40 arcsec with North being up and East to the left. The colour scaling is logarithmic with white corresponding to median BG and black to the 0.1% pixels with the highest intensity. The label in the bottom left states instrument and central wavelength of the filter in micron (I: IRAC, M: MIPS).
SEDs
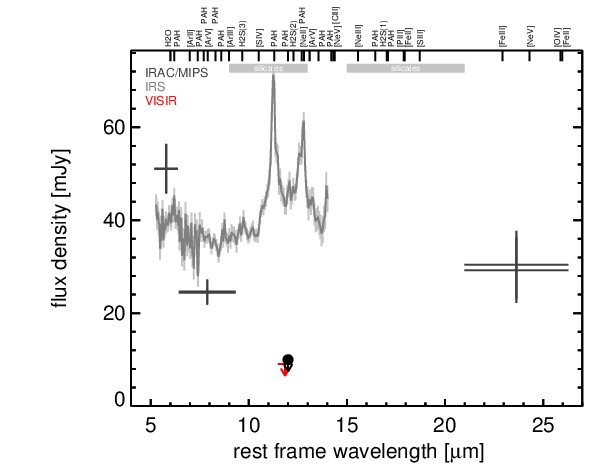

MIR SED. The description of the symbols in all the SED plots (where present) is the following: Grey crosses and solid lines mark the Spitzer/IRAC, MIPS and IRS data. The colour coding of the other symbols is as follows: green for COMICS, magenta for Michelle, blue for T-ReCS and red for VISIR data. Darker-coloured solid lines mark spectra of the corresponding instrument. The black filled circles mark the nuclear 12 and 18 micron continuum emission estimate from the data (where present). The ticks on the top axis mark positions of common MIR emission lines, while the light grey horizontal bars mark wavelength ranges affected by the silicate 10 and 18 micron features.