Sasmirala Individual Information for NGC 3607
Description
NGC 3607 is a low-inclination early-type spiral galaxy at a distance of D = 21.4 ± 2.4 Mpc (NED redshift-independent median) with an AGN optically classified either as LINER [ho_search_1997-1] or Sy 2.0 [veron-cetty_catalogue_2010]. The nucleus is covered by a thick dust filament [barth_search_1998]. It was detected at radio wavelengths [nagar_radio_2005] but not in X-rays [terashima_x-ray_2002, flohic_central_2006], although [gonzalez-martin_fitting_2009] propose that the nucleus could be Compton-thick obscured based on the X-ray to [O III] flux ratio. NGC 3607 remained undetected in IRAS and was only successfully observed in the MIR with Spitzer. In the corresponding IRAC and MIPS images, it appears as an extended elliptical source without a distinct nuclear component. The IRS LR mapping-mode PBCD spectrum contains only the shortest wavelength setting and possibly exhibits PAH emission. The MIR SED from the IRAC and MIPS photometry rather indicates a blue spectral slope in νFν-space consistent with old stellar emission. The nuclear region of NGC 3607 was imaged with VISIR in the PAH1 filter in 2010 (unpublished, to our knowledge) but nothing was detected. Our derived flux upper limit is ~ 50% lower than the IRAC 8.0 μm flux. Therefore, we conclude that host emission is presumably dominating the MIR in the central ~ 0.4 kpc of NGC 3607, and the MIR data are not sufficient to either verify or disfavour the presence of an AGN.
- [barth_search_1998] Aaron J. Barth, Luis C. Ho, Alexei V. Filippenko, and Wallace L. W. Sargent. A search for ultraviolet emission from LINERs . ApJ , 496 pp. 133, March 1998.
- [flohic_central_2006] Hélène M. L. G. Flohic, Michael Eracleous, George Chartas, Joseph C. Shields, and Edward C. Moran. The central engines of 19 LINERs as viewed by chandra . ApJ , 647 pp. 140–160, August 2006.
- [gonzalez-martin_fitting_2009] O. González-Martín, J. Masegosa, I. Márquez, and M. Guainazzi. Fitting liner nuclei within the active galactic nucleus family: A matter of obscuration? . ApJ , 704 pp. 1570–1585, October 2009.
- [ho_search_1997-1] Luis C. Ho, Alexei V. Filippenko, and Wallace L. W. Sargent. A search for ``Dwarf'' seyfert nuclei. III. spectroscopic parameters and properties of the host galaxies . ApJS , 112 pp. 315, October 1997.
- [nagar_radio_2005] N. M. Nagar, H. Falcke, and A. S. Wilson. Radio sources in low-luminosity active galactic nuclei. IV. radio luminosity function, importance of jet power, and radio properties of the complete palomar sample . A&A , 435 pp. 521–543, May 2005.
- [terashima_x-ray_2002] Yuichi Terashima, Naoko Iyomoto, Luis C. Ho, and Andrew F. Ptak. X-ray properties of LINERs and low-luminosity seyfert galaxies observed with ASCA. i. observations and results . ApJS , 139 pp. 1–36, March 2002.
- [veron-cetty_catalogue_2010] M.-P. Véron-Cetty and P. Véron. A catalogue of quasars and active nuclei: 13th edition . A&A , 518 pp. 10, July 2010.
Images
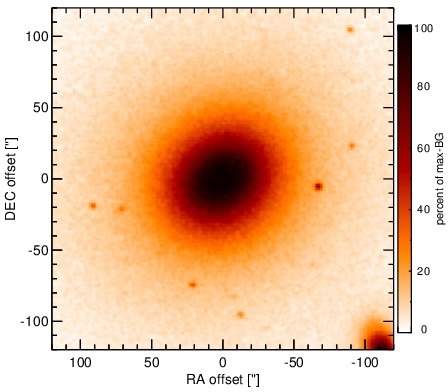
Optical image (DSS, red filter). Displayed are the central 4 arcmin with North being up and East to the left. The colour scaling is linear with white corresponding to the median background (BG) and black to the 0.01% pixels with the highest intensity.
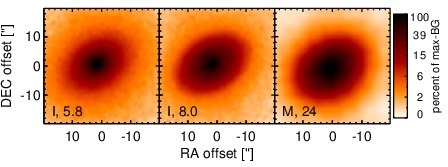
Spitzer MIR images. Displayed are the inner 40 arcsec with North being up and East to the left. The colour scaling is logarithmic with white corresponding to median BG and black to the 0.1% pixels with the highest intensity. The label in the bottom left states instrument and central wavelength of the filter in micron (I: IRAC, M: MIPS).
SEDs
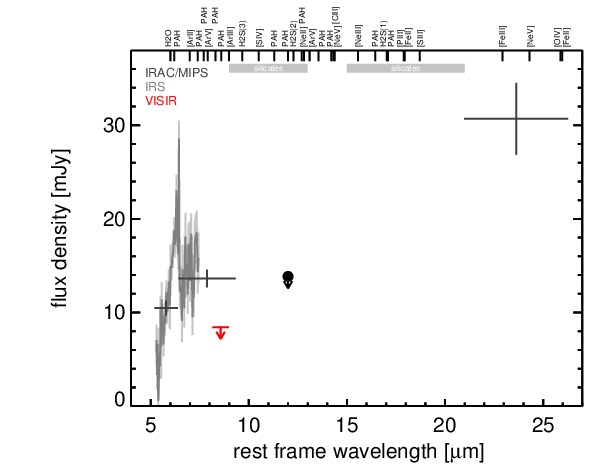
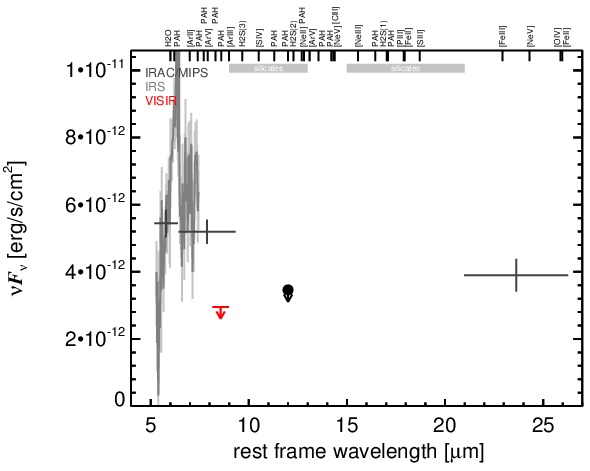
MIR SED. The description of the symbols in all the SED plots (where present) is the following: Grey crosses and solid lines mark the Spitzer/IRAC, MIPS and IRS data. The colour coding of the other symbols is as follows: green for COMICS, magenta for Michelle, blue for T-ReCS and red for VISIR data. Darker-coloured solid lines mark spectra of the corresponding instrument. The black filled circles mark the nuclear 12 and 18 micron continuum emission estimate from the data (where present). The ticks on the top axis mark positions of common MIR emission lines, while the light grey horizontal bars mark wavelength ranges affected by the silicate 10 and 18 micron features.