Sasmirala Individual Information for NGC 3623
Description
NGC 3623 is an inclined spiral galaxy in the Leo Triplet at a distance of D = 12.8 ± 2.2 Mpc (NED redshift-independent median) with a LINER nucleus [ho_search_1997-1]. The first N-band observations of this object were performed by [rieke_10_1978] but the nucleus remained undetected. The Spitzer/IRAC and MIPS images show an extended nucleus embedded in large-scale host emission. We attempted to isolate the nuclear emission component and accordingly our IRAC 5.8 and 8.0 μm and MIPS 24 μm fluxes are significantly lower than the values in [dale_spitzer_2009]. Unfortunately, no Spitzer/IRS data are available for NGC 3623. Also the VISIR observation in the PAH2_2 filter in 2010 failed to detect any nuclear emission (unpublished, to our knowledge). Our derived upper limit is consistent with the Spitzer photometry. It remains unclear, whether NGC 3623 harbours an AGN or not (see also [dudik_chandra_2005]).
- [dale_spitzer_2009] D. A. Dale, J. D. T. Smith, E. A. Schlawin, L. Armus, B. A. Buckalew, S. A. Cohen, G. Helou, T. H. Jarrett, L. C. Johnson, J. Moustakas, E. J. Murphy, H. Roussel, K. Sheth, S. Staudaher, C. Bot, D. Calzetti, C. W. Engelbracht, K. D. Gordon, D. J. Hollenbach, R. C. Kennicutt, and S. Malhotra. The spitzer infrared nearby galaxies survey: A high-resolution spectroscopy anthology . ApJ , 693 pp. 1821–1834, March 2009.
- [dudik_chandra_2005] R. P. Dudik, S. Satyapal, M. Gliozzi, and R. M. Sambruna. A chandra snapshot survey of infrared-bright LINERs: a possible link between star formation, active galactic nucleus fueling, and mass accretion . ApJ , 620 pp. 113–125, February 2005.
- [ho_search_1997-1] Luis C. Ho, Alexei V. Filippenko, and Wallace L. W. Sargent. A search for ``Dwarf'' seyfert nuclei. III. spectroscopic parameters and properties of the host galaxies . ApJS , 112 pp. 315, October 1997.
- [rieke_10_1978] G. H. Rieke and M. J. Lebofsky. 10 micron observations of bright galaxies . ApJL , 220 pp. L37–L41, March 1978.
Images
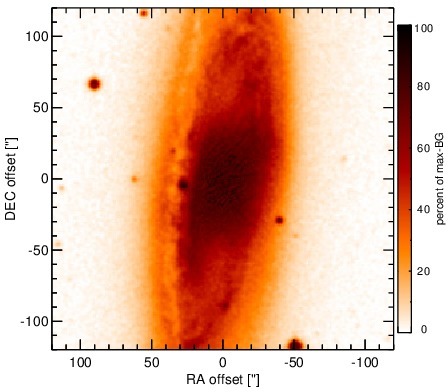
Optical image (DSS, red filter). Displayed are the central 4 arcmin with North being up and East to the left. The colour scaling is linear with white corresponding to the median background (BG) and black to the 0.01% pixels with the highest intensity.
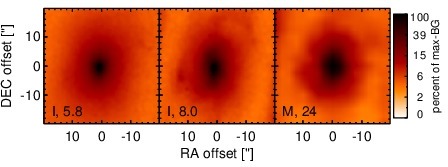
Spitzer MIR images. Displayed are the inner 40 arcsec with North being up and East to the left. The colour scaling is logarithmic with white corresponding to median BG and black to the 0.1% pixels with the highest intensity. The label in the bottom left states instrument and central wavelength of the filter in micron (I: IRAC, M: MIPS).
SEDs
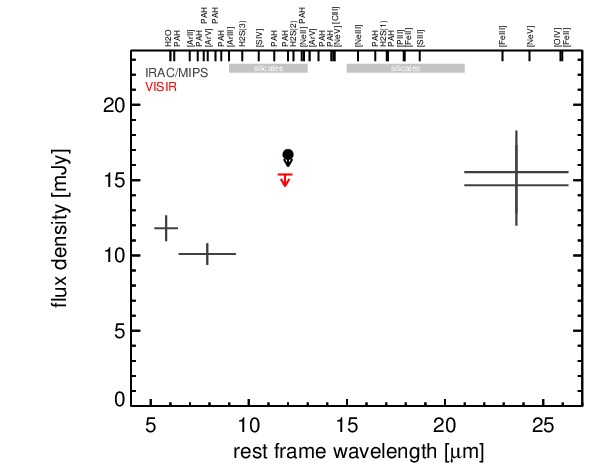
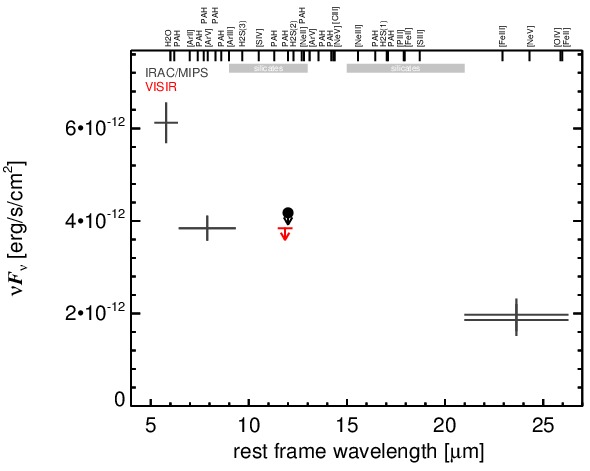
MIR SED. The description of the symbols in all the SED plots (where present) is the following: Grey crosses and solid lines mark the Spitzer/IRAC, MIPS and IRS data. The colour coding of the other symbols is as follows: green for COMICS, magenta for Michelle, blue for T-ReCS and red for VISIR data. Darker-coloured solid lines mark spectra of the corresponding instrument. The black filled circles mark the nuclear 12 and 18 micron continuum emission estimate from the data (where present). The ticks on the top axis mark positions of common MIR emission lines, while the light grey horizontal bars mark wavelength ranges affected by the silicate 10 and 18 micron features.