Sasmirala Individual Information for NGC 3628
Description
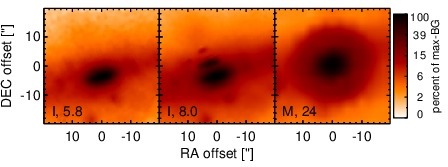
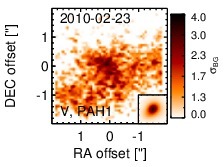
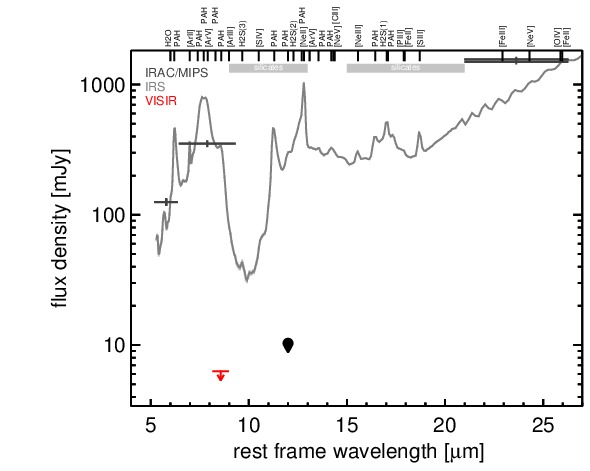
NGC 3628 is a nearby disturbed edge-on spiral galaxy in the Leo Triplet at distance of D = 12.2 ± 2.8 Mpc (NED redshift-independent median) with a prominent dust lane covering an active starburst nucleus, which is optically classified as an AGN/H II transition object [ho_search_1997]. Its association with a compact radio and X-ray source is controversial [filho_nature_2000, nagar_radio_2005, yaqoob_hard_1995, gonzalez-martin_x-ray_2006, flohic_central_2006]. In addition, the detection of the AGN-indicative [Ne V] is also controversial [dudik_mid-infrared_2007, goulding_towards_2009]. NGC 3628 was observed with Spitzer/IRAC, IRS and MIPS, and the corresponding images show bright host galaxy emission with an elongated nucleus without distinguishable unresolved component. The IRS LR staring-mode spectrum exhibits deep silicate 10 and possibly also 18 μm absorption, prominent PAH emission and a red spectral slope in νFν-space (see also [brandl_mid-infrared_2006, goulding_towards_2009, bernard-salas_spitzer_2009]). Thus, the arcsecond-scale MIR SED both indicates star formation and heavy obscuration. The nuclear region of NGC 3628 was observed with VISIR in the PAH1 filter in 2010 (unpublished, to our knowledge). The image shows an elongated MIR structure (major axis~ 7arcsec ~ 0.4 kpc; minimum axis~ 1.7arcsec ~ 100 kpc; PA~ 102∘) with three emission blobs marking the eastern, western and northern borders. The uncertainty in the astrometry of the VISIR data together with the lack of multiwavelength morphological subarcsecond information prohibits the association of the putative AGN with any of the MIR sources. Therefore, we measure the brightest emission blob (the northern) and use its unresolved flux portion as an upper limit for the putative AGN emission. This PAH1 flux makes up only 2% of the corresponding flux from the Spitzer spectrophotometry. We conclude that any AGN contribution to the MIR emission of the central ~ 0.2 kpc is minor in NGC 3628.
- [bernard-salas_spitzer_2009] J. Bernard-Salas, H. W. W. Spoon, V. Charmandaris, V. Lebouteiller, D. Farrah, D. Devost, B. R. Brandl, Yanling Wu, L. Armus, L. Hao, G. C. Sloan, D. Weedman, and J. R. Houck. A spitzer high-resolution mid-infrared spectral atlas of starburst galaxies . ApJS , 184 pp. 230–247, October 2009.
- [brandl_mid-infrared_2006] B. R. Brandl, J. Bernard-Salas, H. W. W. Spoon, D. Devost, G. C. Sloan, S. Guilles, Y. Wu, J. R. Houck, D. W. Weedman, L. Armus, P. N. Appleton, B. T. Soifer, V. Charmandaris, L. Hao, J. A. Marshall Higdon, and T. L. Herter. The mid-infrared properties of starburst galaxies from spitzer-IRS spectroscopy . ApJ , 653 pp. 1129–1144, December 2006.
- [dudik_mid-infrared_2007] R. P. Dudik, J. C. Weingartner, S. Satyapal, Jacqueline Fischer, C. C. Dudley, and B. O'Halloran. Mid-infrared fine-structure line ratios in active galactic nuclei observed with the spitzer IRS: evidence for extinction by the torus . ApJ , 664 pp. 71–87, July 2007.
- [filho_nature_2000] Mercedes E. Filho, Peter D. Barthel, and Luis C. Ho. The nature of composite LINER/H II galaxies as revealed from high-resolution VLA observations . ApJS , 129 pp. 93–110, July 2000.
- [flohic_central_2006] Hélène M. L. G. Flohic, Michael Eracleous, George Chartas, Joseph C. Shields, and Edward C. Moran. The central engines of 19 LINERs as viewed by chandra . ApJ , 647 pp. 140–160, August 2006.
- [gonzalez-martin_x-ray_2006] O. González-Martín, J. Masegosa, I. Márquez, M. A. Guerrero, and D. Dultzin-Hacyan. X-ray nature of the LINER nuclear sources . A&A , 460 pp. 45–57, December 2006.
- [goulding_towards_2009] A. D. Goulding and D. M. Alexander. Towards a complete census of AGN in nearby galaxies: a large population of optically unidentified AGN . MNRAS , 398 pp. 1165–1193, September 2009.
- [ho_search_1997] Luis C. Ho, Alexei V. Filippenko, Wallace L. W. Sargent, and Chien Y. Peng. A search for ``Dwarf'' seyfert nuclei. IV. nuclei with broad h alpha emission . ApJS , 112 pp. 391, October 1997.
- [nagar_radio_2005] N. M. Nagar, H. Falcke, and A. S. Wilson. Radio sources in low-luminosity active galactic nuclei. IV. radio luminosity function, importance of jet power, and radio properties of the complete palomar sample . A&A , 435 pp. 521–543, May 2005.
- [yaqoob_hard_1995] Tahir Yaqoob, Peter J. Serlemitsos, Andy Ptak, Richard Mushotzky, Hideyo Kunieda, and Yuichi Terashima. The hard x-ray emission of NGC 3628 and the contribution of low-luminosity spiral galaxies to the cosmic x-ray background . ApJ , 455 pp. 508, December 1995.
Images

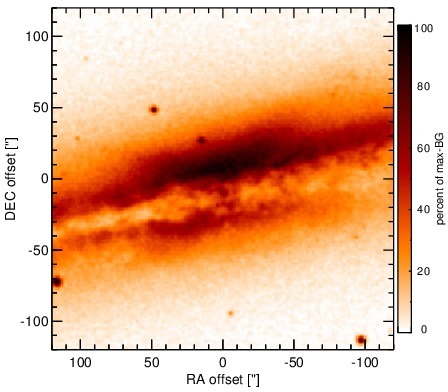
Optical image (DSS, red filter). Displayed are the central 4 arcmin with North being up and East to the left. The colour scaling is linear with white corresponding to the median background (BG) and black to the 0.01% pixels with the highest intensity.

Spitzer MIR images. Displayed are the inner 40 arcsec with North being up and East to the left. The colour scaling is logarithmic with white corresponding to median BG and black to the 0.1% pixels with the highest intensity. The label in the bottom left states instrument and central wavelength of the filter in micron (I: IRAC, M: MIPS).

Subarcsecond-resolution MIR images sorted by increasing filter central wavelength. Displayed are the inner 4 arcsec with North being up and East to the left. The colour scaling is logarithmic with white corresponding to median BG and black to the 75% of the highest intensity of all images in units of sig_bg. The inset image (where present; either bottom or top right) shows the central arcsecond of the PSF from the calibrator star, scaled to match the science target. The labels in the bottom left state instrument and filter names (C: COMICS, M: Michelle, T: T-ReCS, V: VISIR).
SEDs


MIR SED. The description of the symbols in all the SED plots (where present) is the following: Grey crosses and solid lines mark the Spitzer/IRAC, MIPS and IRS data. The colour coding of the other symbols is as follows: green for COMICS, magenta for Michelle, blue for T-ReCS and red for VISIR data. Darker-coloured solid lines mark spectra of the corresponding instrument. The black filled circles mark the nuclear 12 and 18 micron continuum emission estimate from the data (where present). The ticks on the top axis mark positions of common MIR emission lines, while the light grey horizontal bars mark wavelength ranges affected by the silicate 10 and 18 micron features.