Sasmirala Individual Information for NGC 3660
Description
NGC 3660 is a face-on spiral galaxy at a redshift of z = 0.0123 (D ~ 60.8 Mpc) with an active nucleus, which is a “true”-Seyfert 2 candidate ([brightman_nature_2008, bianchi_simultaneous_2012]; but see [shi_unobscured_2010]. The optical classification of this AGN varies throughout the literature: [kollatschny_nuclear_1983] first classified it as a Seyfert/H II transition object, while later it was classified either as borderline LINER/H II [contini_starbursts_1998], Sy 1.8 [veron-cetty_catalogue_2010], or Sy 2.0 [moran_classification_1996, bianchi_simultaneous_2012]. This controversy might be related to the possible existence of a nuclear starburst on the one hand [imanishi_compact_2003], and very weak broad emission lines on the other (see discussion in [shi_unobscured_2010] and [bianchi_simultaneous_2012]). The nucleus features a compact NLR [gonzalez_delgado_h_1997] and radio core [morganti_radio_1999]. The first successful MIR observations of NGC 3660 were reported by [maiolino_new_1995], while it remained undetected in the latter subarcsecond-resolution N-band imaging with Palomar 5 m/MIRLIN [gorjian_10_2004]. The object was detected in the Spitzer/IRAC images where it appears as a compact nucleus surrounded by faint ring-like host emission on large scale. We measure the nuclear component, which provides an IRAC 5.8 μm flux consistent with [gallimore_infrared_2010], while our IRAC 8.0 μm flux is significantly higher. The Spitzer/IRS LR mapping-mode spectrum suffers from low S/N but indicates prominent PAH emission and a red spectral slope in νFν-space (see also [tommasin_spitzer_2008, wu_spitzer/irs_2009, gallimore_infrared_2010, shi_unobscured_2010, tommasin_spitzer-irs_2010]), i.e., significant star formation on arcsecond scales. The nuclear region of NGC 3660 was imaged with T-ReCS in the broad N filter in 2004 (flux published in [videla_nuclear_2013]). In the image, a marginally resolved nucleus is detected (FWHM ~ 0.64arcsec ~ 180 pc; PA~ 96∘). However, at least a second epoch of MIR subarcsecond imaging is required to verify this extension. Our measurement of the nuclear flux is consistent with [videla_nuclear_2013], the Spitzer spectrophotometry and the historical measurements. Thus, presumably even the nuclear flux is significantly star formation contaminated.
- [bianchi_simultaneous_2012] Stefano Bianchi, Francesca Panessa, Xavier Barcons, Francisco J. Carrera, Fabio La Franca, Giorgio Matt, Francesca Onori, Anna Wolter, Amalia Corral, Lorenzo Monaco, Ángel Ruiz, and Murray Brightman. Simultaneous x-ray and optical observations of true type 2 seyfert galaxies . MNRAS , 426 pp. 3225–3240, November 2012.
- [brightman_nature_2008] Murray Brightman and Kirpal Nandra. On the nature of unabsorbed seyfert 2 galaxies . MNRAS , 390 pp. 1241–1249, November 2008.
- [contini_starbursts_1998] T. Contini, S. Considere, and E. Davoust. Starbursts in barred spiral galaxies. III. definition of a homogeneous sample of starburst nucleus galaxies . A&AS , 130 pp. 285–298, June 1998.
- [gallimore_infrared_2010] J. F. Gallimore, A. Yzaguirre, J. Jakoboski, M. J. Stevenosky, D. J. Axon, S. A. Baum, C. L. Buchanan, M. Elitzur, M. Elvis, C. P. O'Dea, and A. Robinson. Infrared spectral energy distributions of seyfert galaxies: Spitzer space telescope observations of the 12 μm sample of active galaxies . ApJS , 187 pp. 172–211, March 2010.
- [gonzalez_delgado_h_1997] Rosa M. Gonzalez Delgado, Enrique Perez, Clive Tadhunter, Jose M. Vilchez, and Jose Miguel Rodriguez-Espinosa. H II region population in a sample of nearby galaxies with nuclear activity. i. data and general results . ApJS , 108 pp. 155, January 1997.
- [gorjian_10_2004] V. Gorjian, M. W. Werner, T. H. Jarrett, D. M. Cole, and M. E. Ressler. 10 micron imaging of seyfert galaxies from the 12 micron sample . ApJ , 605 pp. 156–167, April 2004.
- [imanishi_compact_2003] Masatoshi Imanishi. Compact nuclear starbursts in seyfert 2 galaxies from the CfA and 12 micron samples . ApJ , 599 pp. 918–932, December 2003.
- [kollatschny_nuclear_1983] W. Kollatschny, P. Biermann, K. J. Fricke, W. Huchtmeier, and A. Witzel. Nuclear activity in the barred spiral galaxy NGC 3660 from radio, optical, and x-ray observations . A&A , 119 pp. 80–84, March 1983.
- [maiolino_new_1995] R. Maiolino, M. Ruiz, G. H. Rieke, and L. D. Keller. New constraints on the unified model of seyfert galaxies . ApJ , 446 pp. 561, June 1995.
- [moran_classification_1996] Edward C. Moran, Jules P. Halpern, and David J. Helfand. Classification of IRAS-selected x-ray galaxies in the ROSAT all-sky survey . ApJS , 106 pp. 341, October 1996.
- [morganti_radio_1999] R. Morganti, Z. I. Tsvetanov, J. Gallimore, and M. G. Allen. Radio continuum morphology of southern seyfert galaxies . A&AS , 137 pp. 457–471, June 1999.
- [shi_unobscured_2010] Yong Shi, George H. Rieke, Paul Smith, Jane Rigby, Dean Hines, Jennifer Donley, Gary Schmidt, and Aleksandar M. Diamond-Stanic. Unobscured type 2 active galactic nuclei . ApJ , 714 pp. 115–129, May 2010.
- [tommasin_spitzer-irs_2010] Silvia Tommasin, Luigi Spinoglio, Matthew A. Malkan, and Giovanni Fazio. Spitzer-IRS high-resolution spectroscopy of the 12 μm seyfert galaxies. II. results for the complete data set . ApJ , 709 pp. 1257–1283, February 2010.
- [tommasin_spitzer_2008] Silvia Tommasin, Luigi Spinoglio, Matthew A. Malkan, Howard Smith, Eduardo González-Alfonso, and Vassilis Charmandaris. Spitzer IRS high-resolution spectroscopy of the 12 μm seyfert galaxies. i. first results . ApJ , 676 pp. 836–856, April 2008.
- [veron-cetty_catalogue_2010] M.-P. Véron-Cetty and P. Véron. A catalogue of quasars and active nuclei: 13th edition . A&A , 518 pp. 10, July 2010.
- [videla_nuclear_2013] Liza Videla, Paulina Lira, Heather Andrews, Almudena Alonso-Herrero, David M. Alexander, and Martin Ward. Nuclear infrared spectral energy distribution of type II active galactic nuclei . ApJS , 204 pp. 23, February 2013.
- [wu_spitzer/irs_2009] Yanling Wu, Vassilis Charmandaris, Jiasheng Huang, Luigi Spinoglio, and Silvia Tommasin. Spitzer/IRS 5-35 μm low-resolution spectroscopy of the 12 μm seyfert sample . ApJ , 701 pp. 658–676, August 2009.
Images
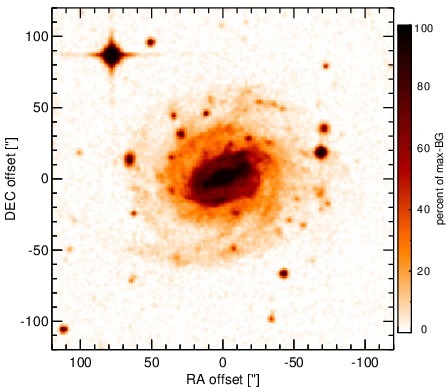
Optical image (DSS, red filter). Displayed are the central 4 arcmin with North being up and East to the left. The colour scaling is linear with white corresponding to the median background (BG) and black to the 0.01% pixels with the highest intensity.
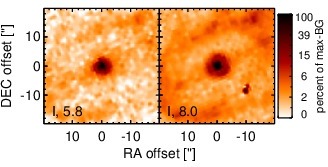
Spitzer MIR images. Displayed are the inner 40 arcsec with North being up and East to the left. The colour scaling is logarithmic with white corresponding to median BG and black to the 0.1% pixels with the highest intensity. The label in the bottom left states instrument and central wavelength of the filter in micron (I: IRAC, M: MIPS).
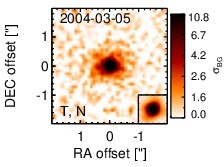
Subarcsecond-resolution MIR images sorted by increasing filter central wavelength. Displayed are the inner 4 arcsec with North being up and East to the left. The colour scaling is logarithmic with white corresponding to median BG and black to the 75% of the highest intensity of all images in units of sig_bg. The inset image (where present; either bottom or top right) shows the central arcsecond of the PSF from the calibrator star, scaled to match the science target. The labels in the bottom left state instrument and filter names (C: COMICS, M: Michelle, T: T-ReCS, V: VISIR).
SEDs
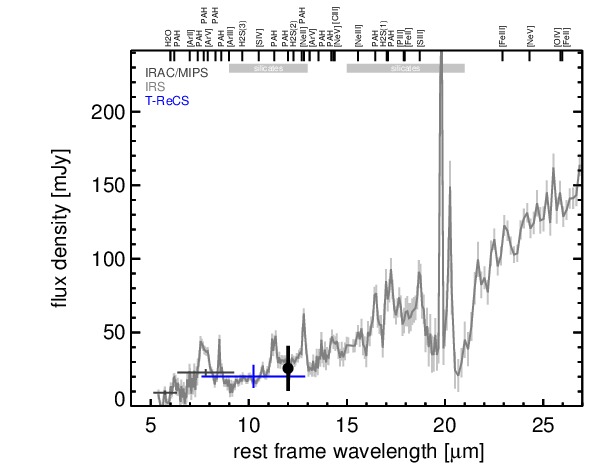
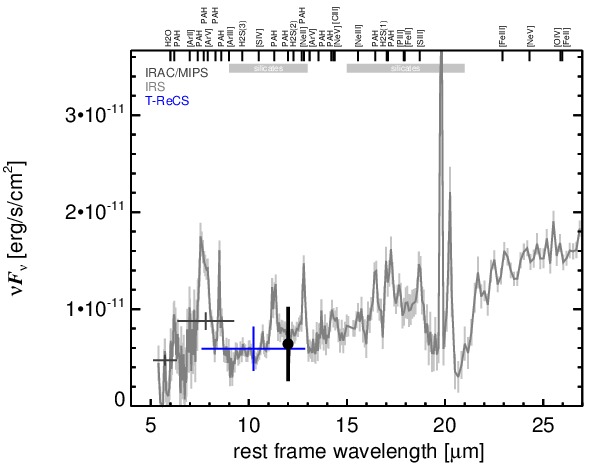
MIR SED. The description of the symbols in all the SED plots (where present) is the following: Grey crosses and solid lines mark the Spitzer/IRAC, MIPS and IRS data. The colour coding of the other symbols is as follows: green for COMICS, magenta for Michelle, blue for T-ReCS and red for VISIR data. Darker-coloured solid lines mark spectra of the corresponding instrument. The black filled circles mark the nuclear 12 and 18 micron continuum emission estimate from the data (where present). The ticks on the top axis mark positions of common MIR emission lines, while the light grey horizontal bars mark wavelength ranges affected by the silicate 10 and 18 micron features.