Sasmirala Individual Information for NGC 3690E
Description
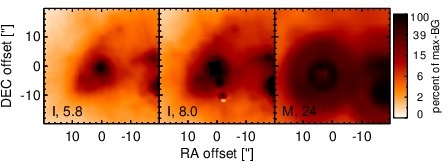
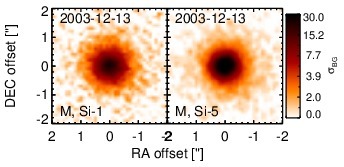
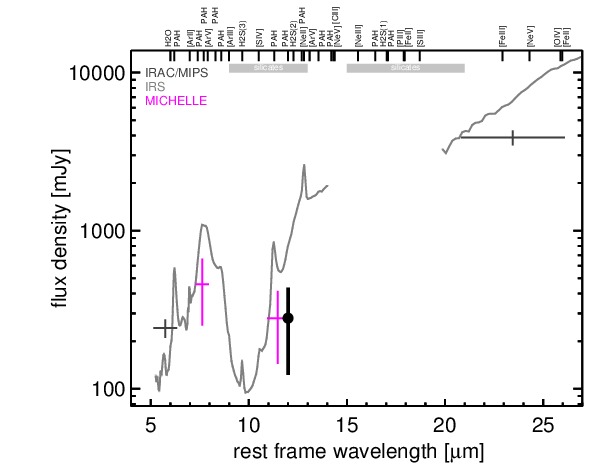
NGC 3690 is a pair of merging late-type galaxies at a distance of D = ~ 45 Mpc. The two nuclei are separated by 20arcsec (~ 4.3 kpc) and have been designated with various names, leading to confusion in the literature. Therefore, we refer to the western nucleus as NGC 3690W, it is also called NGC 3690A, Arp 299B, UGC 6472 and sometimes just NGC 3690. We call the eastern nucleus correspondingly NGC 3690E (NGC 3690B, Arp 299A, UGC 6471), which is often wrongly called IC 694 (see NED and [yamaoka_supernova_1998]). NGC 3690W is classified as a H II nucleus in [veron-cetty_catalogue_2010], while NGC 3690E is not even included. However, based on the evidence from deep X-ray, optical and radio observations, NGC 3690W is possibly a Sy 2 and NGC 3690E possibly a LINER [ballo_arp_2004, garcia-marin_integral_2006, perez-torres_serendipitous_2010]. At the same time, the whole NGC 3690 system is one of the most extreme cases of an extended burst of star formation known [augarde_peculiar_1985] and has been studied extensively during the last 40 years. Both NGC 3690E and NGC 3690W contain luminous water maser emission possibly associated with AGN activity [henkel_new_2005, tarchi_new_2011]. Early ground-based N-band photometry of NGC 3690 was performed by [rieke_infrared_1972, allen_near-infrared_1976, lebofsky_extinction_1979, gehrz_star_1983, carico_iras_1988, keto_infrared_1997] and [miles_high-resolution_1996]. Both nuclei are detected in the first N-band images and two additional compact sources (C and C’) are found ~ 8arcsec (~ 1.7 kpc) north of the NGC 3690W nucleus (B1), while the whole system is embedded in diffuse MIR emission [gehrz_star_1983]. [soifer_high-resolution_2001] present the first subarcsecond resolution N- and Q-band images of NGC 3690 obtained with Keck/LWS, which verify the morphology found earlier and further constrain the MIR emission of the two nuclei to be confined to < 0.6arcsec (~ 130 pc). The first MIR spectroscopic study using ISO was [gallais_dust_2004]. They find strong PAH emission and silicate absorption in NGC3690E, indicating a deeply embedded starburst, and strong silicate but less PAH emission in NGC3690W. From this and the emission line ratios, they interpret that a deeply absorbed AGN exist in this nucleus. The Spitzer/IRAC, IRS and MIPS data verifies the morphology and MIR SEDs of NGC 3690. Note that the IRAC 8 μm image is saturated in both nuclei and thus we could not perform nuclear photometry in this waveband. A comprehensive study of the IRS spectra of NGC 3690 can be found in [alonso-herrero_extreme_2009]. The system was observed with Gemini/Michelle in 2003 in the N-band filters Si-1 and Si-5, in which the pointing was centred on NGC 3690E. Therefore, the nucleus of NGC 3690W is only visible in one of the negative chopping positions. Because Michelle is unguided in these positions, we can only measure the total flux of the source but not constrain its morphology. The nucleus of NGC 3690E is possibly extended (FWHM~ 1arcsec, 215 pc) but this remains to be verified with another epoch. The Michelle fluxes of both nuclei marginally agree with the Spitzer data, although the PAH emission seems to be weaker at the high angular resolution. Note that the nuclear fluxes would be significantly lower if the presence of subarcsecond-extended emission can be verified.
- [allen_near-infrared_1976] D. A. Allen. The near-infrared continua of emission-line galaxies . ApJ , 207 pp. 367–375, July 1976.
- [alonso-herrero_extreme_2009] Almudena Alonso-Herrero, George H. Rieke, Luis Colina, Miguel Pereira-Santaella, Macarena García-Marín, J.-D. T. Smith, Bernhard Brandl, Vassilis Charmandaris, and Lee Armus. The extreme star formation activity of arp 299 revealed by spitzer IRS spectral mapping . ApJ , 697 pp. 660–675, May 2009.
- [augarde_peculiar_1985] R. Augarde and J. Lequeux. Peculiar motions and star formation in the interacting galaxy complex MK 171 = NGC 3690 + IC 694 . A&A , 147 pp. 273–280, June 1985.
- [ballo_arp_2004] L. Ballo, V. Braito, R. Della Ceca, L. Maraschi, F. Tavecchio, and M. Dadina. Arp 299: A second merging system with two active nuclei? . ApJ , 600 pp. 634–639, January 2004.
- [carico_iras_1988] David P. Carico, D. B. Sanders, B. T. Soifer, J. H. Elias, K. Matthews, and G. Neugebauer. The IRAS bright galaxy sample. III - 1-10 micron observations and coadded IRAS data for galaxies with l(IR) equal to or greater than 10 to the 11th solar luminosities . AJ , 95 pp. 356–373, February 1988.
- [gallais_dust_2004] P. Gallais, V. Charmandaris, E. Le Floc'h, I. F. Mirabel, M. Sauvage, L. Vigroux, and O. Laurent. Dust enshrouded star-forming activity in arp 299 . A&A , 414 pp. 845–855, February 2004.
- [garcia-marin_integral_2006] M. García-Marín, L. Colina, S. Arribas, A. Alonso-Herrero, and E. Mediavilla. Integral field spectroscopy of the luminous infrared galaxy arp 299 (IC 694 + NGC 3690) . ApJ , 650 pp. 850–871, October 2006.
- [gehrz_star_1983] R. D. Gehrz, R. A. Sramek, and D. W. Weedman. Star bursts and the extraordinary galaxy NGC 3690 . ApJ , 267 pp. 551–562, April 1983.
- [henkel_new_2005] C. Henkel, A. B. Peck, A. Tarchi, N. M. Nagar, J. A. Braatz, P. Castangia, and L. Moscadelli. New H2O masers in seyfert and FIR bright galaxies . A&A , 436 pp. 75–90, June 2005.
- [keto_infrared_1997] Eric Keto, Joseph L. Hora, Lynne Deutsch, William Hoffmann, G. G. Fazio, Roger Ball, Margaret Meixner, Christopher Skinner, J. F. Arens, and Garrett Jernigan. The infrared bright nuclei in the mid-infrared . ApJ , 485 pp. 598, August 1997.
- [lebofsky_extinction_1979] M. J. Lebofsky and G. H. Rieke. Extinction in infrared-emitting galactic nuclei . ApJ , 229 pp. 111–117, April 1979.
- [miles_high-resolution_1996] J. W. Miles, J. R. Houck, T. L. Hayward, and M. L. N. Ashby. High-resolution mid-infrared imaging of infrared-luminous galaxies . ApJ , 465 pp. 191, July 1996.
- [perez-torres_serendipitous_2010] M. A. Pérez-Torres, A. Alberdi, C. Romero-Cañizales, and M. Bondi. Serendipitous discovery of the long-sought active galactic nucleus in arp 299-a . A&A , 519 pp. L5, September 2010.
- [rieke_infrared_1972] G. H. Rieke and F. J. Low. Infrared photometry of extragalactic sources . ApJL , 176 pp. L95, September 1972.
- [soifer_high-resolution_2001] B. T. Soifer, G. Neugebauer, K. Matthews, E. Egami, A. J. Weinberger, M. Ressler, N. Z. Scoville, S. R. Stolovy, J. J. Condon, and E. E. Becklin. High-resolution mid-infrared imaging of infrared-luminous starburst galaxies . AJ , 122 pp. 1213–1237, September 2001.
- [tarchi_new_2011] A. Tarchi, P. Castangia, C. Henkel, G. Surcis, and K. M. Menten. New H2O masers in seyfert and FIR bright galaxies. IV. interferometric follow-ups . A&A , 525 pp. 91, January 2011.
- [veron-cetty_catalogue_2010] M.-P. Véron-Cetty and P. Véron. A catalogue of quasars and active nuclei: 13th edition . A&A , 518 pp. 10, July 2010.
- [yamaoka_supernova_1998] H. Yamaoka, T. Kato, A. V. Filippenko, S. D. van Dyk, M. Yamamoto, D. Balam, K. Hornoch, and M. Plsek. Supernova 1998T in NGC 3690 . International Astronomical Union Circular , 6859 pp. 1, April 1998.
Images

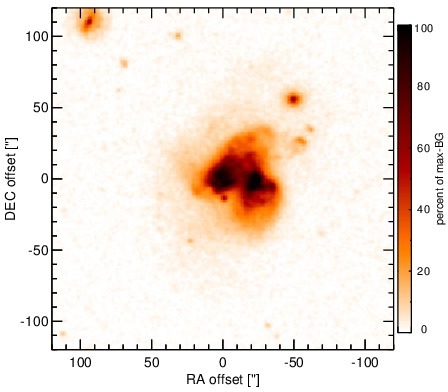
Optical image (DSS, red filter). Displayed are the central 4 arcmin with North being up and East to the left. The colour scaling is linear with white corresponding to the median background (BG) and black to the 0.01% pixels with the highest intensity.

Spitzer MIR images. Displayed are the inner 40 arcsec with North being up and East to the left. The colour scaling is logarithmic with white corresponding to median BG and black to the 0.1% pixels with the highest intensity. The label in the bottom left states instrument and central wavelength of the filter in micron (I: IRAC, M: MIPS).

Subarcsecond-resolution MIR images sorted by increasing filter central wavelength. Displayed are the inner 4 arcsec with North being up and East to the left. The colour scaling is logarithmic with white corresponding to median BG and black to the 75% of the highest intensity of all images in units of sig_bg. The inset image (where present; either bottom or top right) shows the central arcsecond of the PSF from the calibrator star, scaled to match the science target. The labels in the bottom left state instrument and filter names (C: COMICS, M: Michelle, T: T-ReCS, V: VISIR).
SEDs


MIR SED. The description of the symbols in all the SED plots (where present) is the following: Grey crosses and solid lines mark the Spitzer/IRAC, MIPS and IRS data. The colour coding of the other symbols is as follows: green for COMICS, magenta for Michelle, blue for T-ReCS and red for VISIR data. Darker-coloured solid lines mark spectra of the corresponding instrument. The black filled circles mark the nuclear 12 and 18 micron continuum emission estimate from the data (where present). The ticks on the top axis mark positions of common MIR emission lines, while the light grey horizontal bars mark wavelength ranges affected by the silicate 10 and 18 micron features.