Sasmirala Individual Information for NGC 3982
Description
NGC 3982 is a face-on barred spiral galaxy at a distance of D = 21.4 ± 2.2 Mpc (NED redshift-independent median) with an AGN optically classified either as Sy 1.9 or Sy 2 [trippe_multi-wavelength_2010]. It features an unresolved NLR [gonzalez_delgado_h_1997] and unresolved radio core [ho_radio_2001]. The first ground-based MIR observations of NGC 3982 were carried out after IRAS but the nucleus was not detected [edelson_broad-band_1987, devereux_spatial_1987]. [maiolino_new_1995] claim the first weak detection, while it again was undetected in the first subarcsecond MIR imaging with Palomar 5 m/MIRLIN [gorjian_10_2004]. At low angular resolution, NGC 3982 has been studied with ISO (e.g., [ramos_almeida_mid-infrared_2007]) and Spitzer/IRAC and IRS. The corresponding IRAC images show a compact nucleus embedded within relatively bright spiral-like host emission. Therefore, our IRAC 5.8 and 8.0 μm fluxes of only the nuclear four-arcsecond region are much lower than the values of [gallimore_infrared_2010]. The nuclear IRS LR mapping-mode spectrum suffers from a low S/N but indicates PAH emission and a red spectral slope in νFν-space. Note that at least part of the circum-nuclear star formation is cancelled through our background subtraction (see also [buchanan_spitzer_2006, wu_spitzer/irs_2009, tommasin_spitzer-irs_2010, trippe_multi-wavelength_2010, gallimore_infrared_2010]). We observed the nuclear region of NGC 3982 with Michelle in two N-band filters in 2010 and detected a possibly marginally resolved nucleus without any further host emission (FWHM ~ 0.48arcsec ~ 50 pc). However, the data are not sufficient for a robust classification of the nuclear extension in the MIR at subarcsecond resolution. Our nuclear photometry is on average ~ 36% lower than the Spitzer spectrophotometry verifying that the MIR emission of the arcsecond scale region is star formation contaminated. Finally, these results are consistent with the previous MIR observations.
- [buchanan_spitzer_2006] Catherine L. Buchanan, Jack F. Gallimore, Christopher P. O'Dea, Stefi A. Baum, David J. Axon, Andrew Robinson, Moshe Elitzur, and Martin Elvis. Spitzer IRS spectra of a large sample of seyfert galaxies: A variety of infrared spectral energy distributions in the local active galactic nucleus population . AJ , 132 pp. 401–419, July 2006.
- [devereux_spatial_1987] Nicholas Devereux. The spatial distribution of 10 micron luminosity in spiral galaxies . ApJ , 323 pp. 91–107, December 1987.
- [edelson_broad-band_1987] R. A. Edelson, M. A. Malkan, and G. H. Rieke. Broad-band properties of the CfA seyfert galaxies. II - infrared to millimeter properties . ApJ , 321 pp. 233–250, October 1987.
- [gallimore_infrared_2010] J. F. Gallimore, A. Yzaguirre, J. Jakoboski, M. J. Stevenosky, D. J. Axon, S. A. Baum, C. L. Buchanan, M. Elitzur, M. Elvis, C. P. O'Dea, and A. Robinson. Infrared spectral energy distributions of seyfert galaxies: Spitzer space telescope observations of the 12 μm sample of active galaxies . ApJS , 187 pp. 172–211, March 2010.
- [gonzalez_delgado_h_1997] Rosa M. Gonzalez Delgado, Enrique Perez, Clive Tadhunter, Jose M. Vilchez, and Jose Miguel Rodriguez-Espinosa. H II region population in a sample of nearby galaxies with nuclear activity. i. data and general results . ApJS , 108 pp. 155, January 1997.
- [gorjian_10_2004] V. Gorjian, M. W. Werner, T. H. Jarrett, D. M. Cole, and M. E. Ressler. 10 micron imaging of seyfert galaxies from the 12 micron sample . ApJ , 605 pp. 156–167, April 2004.
- [ho_radio_2001] Luis C. Ho and James S. Ulvestad. Radio continuum survey of an optically selected sample of nearby seyfert galaxies . ApJS , 133 pp. 77–118, March 2001.
- [maiolino_new_1995] R. Maiolino, M. Ruiz, G. H. Rieke, and L. D. Keller. New constraints on the unified model of seyfert galaxies . ApJ , 446 pp. 561, June 1995.
- [ramos_almeida_mid-infrared_2007] C. Ramos Almeida, A. M. Pérez García, J. A. Acosta-Pulido, and J. M. Rodríguez Espinosa. The mid-infrared emission of seyfert galaxies: A new analysis of ISOCAM data . AJ , 134 pp. 2006–2019, November 2007.
- [tommasin_spitzer-irs_2010] Silvia Tommasin, Luigi Spinoglio, Matthew A. Malkan, and Giovanni Fazio. Spitzer-IRS high-resolution spectroscopy of the 12 μm seyfert galaxies. II. results for the complete data set . ApJ , 709 pp. 1257–1283, February 2010.
- [trippe_multi-wavelength_2010] M. L. Trippe, D. M. Crenshaw, R. P. Deo, M. Dietrich, S. B. Kraemer, S. E. Rafter, and T. J. Turner. A multi-wavelength study of the nature of type 1.8/1.9 seyfert galaxies . ApJ , 725 pp. 1749–1767, December 2010.
- [wu_spitzer/irs_2009] Yanling Wu, Vassilis Charmandaris, Jiasheng Huang, Luigi Spinoglio, and Silvia Tommasin. Spitzer/IRS 5-35 μm low-resolution spectroscopy of the 12 μm seyfert sample . ApJ , 701 pp. 658–676, August 2009.
Images
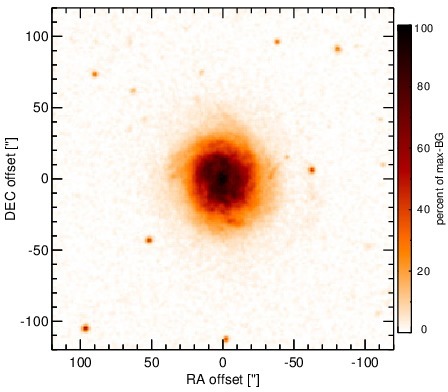
Optical image (DSS, red filter). Displayed are the central 4 arcmin with North being up and East to the left. The colour scaling is linear with white corresponding to the median background (BG) and black to the 0.01% pixels with the highest intensity.
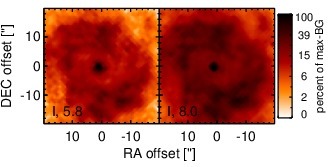
Spitzer MIR images. Displayed are the inner 40 arcsec with North being up and East to the left. The colour scaling is logarithmic with white corresponding to median BG and black to the 0.1% pixels with the highest intensity. The label in the bottom left states instrument and central wavelength of the filter in micron (I: IRAC, M: MIPS).
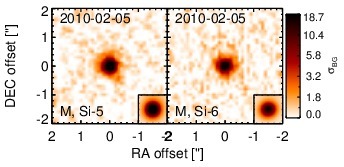
Subarcsecond-resolution MIR images sorted by increasing filter central wavelength. Displayed are the inner 4 arcsec with North being up and East to the left. The colour scaling is logarithmic with white corresponding to median BG and black to the 75% of the highest intensity of all images in units of sig_bg. The inset image (where present; either bottom or top right) shows the central arcsecond of the PSF from the calibrator star, scaled to match the science target. The labels in the bottom left state instrument and filter names (C: COMICS, M: Michelle, T: T-ReCS, V: VISIR).
SEDs
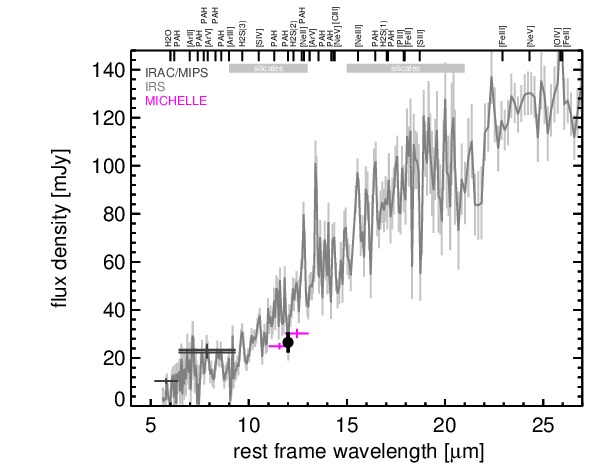

MIR SED. The description of the symbols in all the SED plots (where present) is the following: Grey crosses and solid lines mark the Spitzer/IRAC, MIPS and IRS data. The colour coding of the other symbols is as follows: green for COMICS, magenta for Michelle, blue for T-ReCS and red for VISIR data. Darker-coloured solid lines mark spectra of the corresponding instrument. The black filled circles mark the nuclear 12 and 18 micron continuum emission estimate from the data (where present). The ticks on the top axis mark positions of common MIR emission lines, while the light grey horizontal bars mark wavelength ranges affected by the silicate 10 and 18 micron features.