Sasmirala Individual Information for NGC 4051
Description
NGC 4051 is a low-inclination grand-design spiral galaxy at a distance of D = 12.2 ± 2.4 Mpc [tully_extragalactic_2009] and belongs to the original six Seyfert galaxies [seyfert_nuclear_1943]. It contains a well-studied variable AGN (see [maitra_jet_2011] for a recent analysis if its SED), which is classified optically either as Sy 1n [veron-cetty_catalogue_2010] or Sy 1.2 [ho_search_1997-1]. It is a member of the nine-month BAT AGN sample. The nucleus has a complex radio morphology with a double/triple source with ~ 0.4arcsec separation in east-west direction [ulvestad_radio_1984, kukula_high-resolution_1995] and a very weak central unresolved source [giroletti_faintest_2009]. A weak extended NLR component coincides with the radio structure (diameter~ 1.2arcsec ~ 71 pc; PA~ 100∘; [schmitt_comparison_1996]). In addition, very weak water maser emission was detected in the nucleus with uncertain relation to the AGN [hagiwara_search_2003, hagiwara_low-luminosity_2007]. The first successful MIR observations were performed by [rieke_infrared_1972], followed by [rieke_infrared_1978] and [lebofsky_extinction_1979], [aitken_8-13_1985],[devereux_spatial_1987], [roche_atlas_1991]. The first subarcsecond-resolution N-band image was obtained with Palomar 5 m/MIRLIN in 2000 [gorjian_10_2004], where a point-like nucleus without host emission was detected. In addition, ISO (e.g., [ramos_almeida_mid-infrared_2007]) and Spitzer/IRAC, IRS and MIPS observations are available. In the IRAC 5.8 and 8.0 μm and MIPS 24 μm images, the compact nucleus completely dominates the MIR emission, while the host is only weakly visible. The latter becomes brighter towards longer wavelengths. Our nuclear IRAC 5.8 and 8.0 μm photometry is consistent with [gallimore_infrared_2010]. The IRS LR staring-mode spectrum exhibits weak silicate 10 and 18 μm emission, prominent PAH features, and a shallow emission peak at ~ 18μm in νFν-space (see also [buchanan_spitzer_2006, wu_spitzer/irs_2009, deo_mid-infrared_2009, goulding_towards_2009, tommasin_spitzer-irs_2010]). Note however that no background subtraction was performed for the long-wavelength part of the spectrum (> 14 μm). The presence of the PAH emission indicates that the arcsecond-scale MIR SED is affected by star formation. The Spitzer spectrophotometry is consistent with the MIRLIN flux but significantly higher than the historical measurements. We observed the nuclear region of NGC 4051 with Michelle in the Si-5 filter in 2010 and detected a possibly marginally resolved nucleus without any other host emission (FWHM ~ 0.44arcsec ~ 26 pc). However, the current data are not sufficient for a robust classification of the nuclear extension in the MIR at subarcsecond scales. The nuclear photometry is 21% lower than the Spitzer spectrophotometry. The current subarcsecond data are not sufficient to constrain the star formation contribution in the central ~ 25 pc.
- [aitken_8-13_1985] D. K. Aitken and P. F. Roche. 8-13 microns spectrophotometry of galaxies. IV - six more seyferts and 3C345. v - the nuclei of five spiral galaxies . MNRAS , 213 pp. 777–797, April 1985.
- [buchanan_spitzer_2006] Catherine L. Buchanan, Jack F. Gallimore, Christopher P. O'Dea, Stefi A. Baum, David J. Axon, Andrew Robinson, Moshe Elitzur, and Martin Elvis. Spitzer IRS spectra of a large sample of seyfert galaxies: A variety of infrared spectral energy distributions in the local active galactic nucleus population . AJ , 132 pp. 401–419, July 2006.
- [deo_mid-infrared_2009] Rajesh P. Deo, Gordon T. Richards, D. M. Crenshaw, and S. B. Kraemer. The mid-infrared continua of seyfert galaxies . ApJ , 705 pp. 14–31, November 2009.
- [devereux_spatial_1987] Nicholas Devereux. The spatial distribution of 10 micron luminosity in spiral galaxies . ApJ , 323 pp. 91–107, December 1987.
- [gallimore_infrared_2010] J. F. Gallimore, A. Yzaguirre, J. Jakoboski, M. J. Stevenosky, D. J. Axon, S. A. Baum, C. L. Buchanan, M. Elitzur, M. Elvis, C. P. O'Dea, and A. Robinson. Infrared spectral energy distributions of seyfert galaxies: Spitzer space telescope observations of the 12 μm sample of active galaxies . ApJS , 187 pp. 172–211, March 2010.
- [giroletti_faintest_2009] Marcello Giroletti and Francesca Panessa. The faintest seyfert radio cores revealed by VLBI . ApJL , 706 pp. L260–L264, December 2009.
- [gorjian_10_2004] V. Gorjian, M. W. Werner, T. H. Jarrett, D. M. Cole, and M. E. Ressler. 10 micron imaging of seyfert galaxies from the 12 micron sample . ApJ , 605 pp. 156–167, April 2004.
- [goulding_towards_2009] A. D. Goulding and D. M. Alexander. Towards a complete census of AGN in nearby galaxies: a large population of optically unidentified AGN . MNRAS , 398 pp. 1165–1193, September 2009.
- [hagiwara_low-luminosity_2007] Yoshiaki Hagiwara. Low-luminosity extragalactic water masers toward m82, m51, and NGC 4051 . AJ , 133 pp. 1176–1186, March 2007.
- [hagiwara_search_2003] Yoshiaki Hagiwara, Philip J. Diamond, Makoto Miyoshi, Emmanouel Rovilos, and Willem Baan. A search for extragalactic H2O maser emission towards IRAS galaxies - II. discovery of an H2O maser in the type 1 seyfert galaxy NGC 4051 . MNRAS , 344 pp. L53–L57, October 2003.
- [ho_search_1997-1] Luis C. Ho, Alexei V. Filippenko, and Wallace L. W. Sargent. A search for ``Dwarf'' seyfert nuclei. III. spectroscopic parameters and properties of the host galaxies . ApJS , 112 pp. 315, October 1997.
- [kukula_high-resolution_1995] Marek J. Kukula, Alan Pedlar, Stefi A. Baum, and Christopher P. O'Dea. High-resolution radio observations of the CfA seyfert sample -i. the observations . MNRAS , 276 pp. 1262–1280, October 1995.
- [lebofsky_extinction_1979] M. J. Lebofsky and G. H. Rieke. Extinction in infrared-emitting galactic nuclei . ApJ , 229 pp. 111–117, April 1979.
- [maitra_jet_2011] Dipankar Maitra, Jon M. Miller, Sera Markoff, and Ashley King. A jet model for the broadband spectrum of the seyfert 1 galaxy NGC 4051 . ApJ , 735 pp. 107, July 2011.
- [ramos_almeida_mid-infrared_2007] C. Ramos Almeida, A. M. Pérez García, J. A. Acosta-Pulido, and J. M. Rodríguez Espinosa. The mid-infrared emission of seyfert galaxies: A new analysis of ISOCAM data . AJ , 134 pp. 2006–2019, November 2007.
- [rieke_infrared_1972] G. H. Rieke and F. J. Low. Infrared photometry of extragalactic sources . ApJL , 176 pp. L95, September 1972.
- [rieke_infrared_1978] G. H. Rieke. The infrared emission of seyfert galaxies . ApJ , 226 pp. 550–558, December 1978.
- [roche_atlas_1991] Patrick F. Roche, David K. Aitken, Craig H. Smith, and Martin J. Ward. An atlas of mid-infrared spectra of galaxy nuclei . MNRAS , 248 pp. 606–629, February 1991.
- [schmitt_comparison_1996] Henrique R. Schmitt and Anne L. Kinney. A comparison between the narrow-line regions of seyfert 1 and seyfert 2 galaxies . ApJ , 463 pp. 498, June 1996.
- [seyfert_nuclear_1943] Carl K. Seyfert. Nuclear emission in spiral nebulae. . ApJ , 97 pp. 28, January 1943.
- [tommasin_spitzer-irs_2010] Silvia Tommasin, Luigi Spinoglio, Matthew A. Malkan, and Giovanni Fazio. Spitzer-IRS high-resolution spectroscopy of the 12 μm seyfert galaxies. II. results for the complete data set . ApJ , 709 pp. 1257–1283, February 2010.
- [tully_extragalactic_2009] R. Brent Tully, Luca Rizzi, Edward J. Shaya, Hélène M. Courtois, Dmitry I. Makarov, and Bradley A. Jacobs. The extragalactic distance database . AJ , 138 pp. 323–331, August 2009.
- [ulvestad_radio_1984] J. S. Ulvestad and A. S. Wilson. Radio structures of seyfert galaxies. VI - VLA observations of a nearby sample . ApJ , 285 pp. 439–452, October 1984.
- [veron-cetty_catalogue_2010] M.-P. Véron-Cetty and P. Véron. A catalogue of quasars and active nuclei: 13th edition . A&A , 518 pp. 10, July 2010.
- [wu_spitzer/irs_2009] Yanling Wu, Vassilis Charmandaris, Jiasheng Huang, Luigi Spinoglio, and Silvia Tommasin. Spitzer/IRS 5-35 μm low-resolution spectroscopy of the 12 μm seyfert sample . ApJ , 701 pp. 658–676, August 2009.
Images
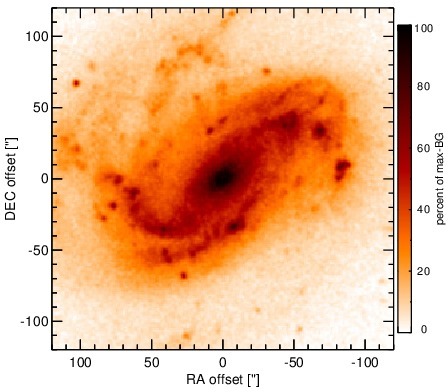
Optical image (DSS, red filter). Displayed are the central 4 arcmin with North being up and East to the left. The colour scaling is linear with white corresponding to the median background (BG) and black to the 0.01% pixels with the highest intensity.
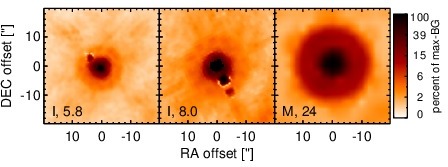
Spitzer MIR images. Displayed are the inner 40 arcsec with North being up and East to the left. The colour scaling is logarithmic with white corresponding to median BG and black to the 0.1% pixels with the highest intensity. The label in the bottom left states instrument and central wavelength of the filter in micron (I: IRAC, M: MIPS).
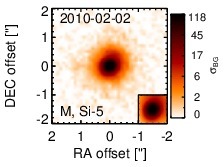
Subarcsecond-resolution MIR images sorted by increasing filter central wavelength. Displayed are the inner 4 arcsec with North being up and East to the left. The colour scaling is logarithmic with white corresponding to median BG and black to the 75% of the highest intensity of all images in units of sig_bg. The inset image (where present; either bottom or top right) shows the central arcsecond of the PSF from the calibrator star, scaled to match the science target. The labels in the bottom left state instrument and filter names (C: COMICS, M: Michelle, T: T-ReCS, V: VISIR).
SEDs
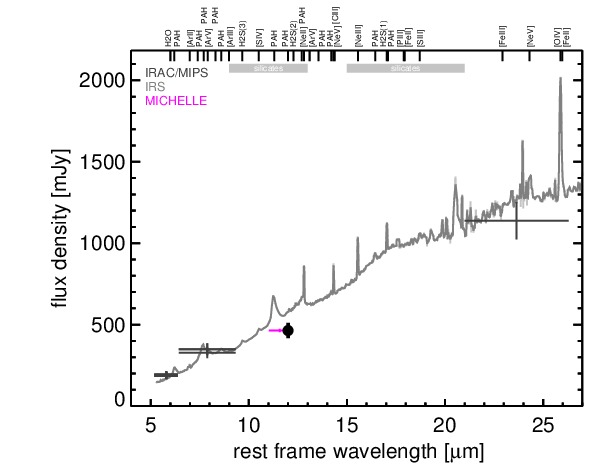
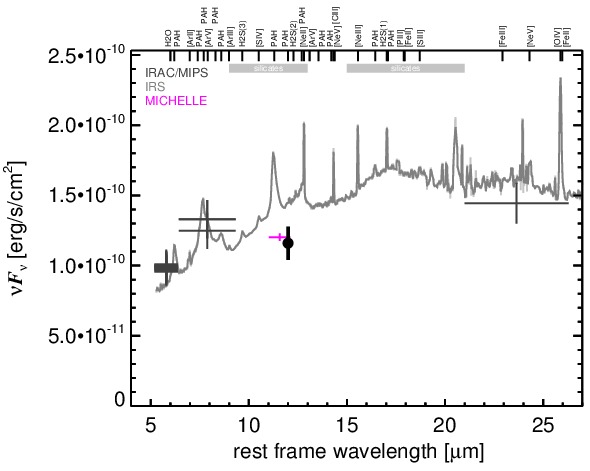
MIR SED. The description of the symbols in all the SED plots (where present) is the following: Grey crosses and solid lines mark the Spitzer/IRAC, MIPS and IRS data. The colour coding of the other symbols is as follows: green for COMICS, magenta for Michelle, blue for T-ReCS and red for VISIR data. Darker-coloured solid lines mark spectra of the corresponding instrument. The black filled circles mark the nuclear 12 and 18 micron continuum emission estimate from the data (where present). The ticks on the top axis mark positions of common MIR emission lines, while the light grey horizontal bars mark wavelength ranges affected by the silicate 10 and 18 micron features.