Sasmirala Individual Information for NGC 4074
Description
NGC 4074 is a peculiar early-type galaxy with a high surface brightness at a redshift of z = 0.0224 (D ~ 107 Mpc). It contains a Sy 2 nucleus [veron-cetty_catalogue_2010] that belongs to the nine-month BAT AGN sample. The NLR and radio emission appears to be mostly compact with weak extended radio emission along a PA~ 131∘ [mulchaey_emission-line_1996, nagar_radio_1999]. NGC 4074 was not detected by IRAS and no other MIR observations of it have been published so far. It appears unresolved in the WISE band 3 and 4 images. In addition, a Spitzer/IRS LR staring-mode spectrum is available, which shows silicate 10 μm and possibly 18 μm emission, weak PAH features, prominent forbidden ionization lines, and an emission peak at ~ 17 μm in νFν-space. Therefore, the arcsecond-scale MIR SED is clearly AGN dominated. Interestingly, it indicates an unobscured AGN contrary to its optical classification. We observed NGC 4074 with VISIR in the NEII filter in 2010 and detected a marginally resolved nucleus without any further host emission (FWHM ~ 0.4arcsec ~ 200 pc). However, the extension needs to be confirmed by at least a second epoch of subarcsecond MIR imaging. The nuclear photometry is 25% lower than the IRS flux levels. Comparison with the WISE band 3 flux indicates that the AGN dominates the total MIR emission of NGC 4074.
- [mulchaey_emission-line_1996] John S. Mulchaey, Andrew S. Wilson, and Zlatan Tsvetanov. An emission-line imaging survey of early-type seyfert galaxies. i. the observations . ApJS , 102 pp. 309, February 1996.
- [nagar_radio_1999] Neil M. Nagar, Andrew S. Wilson, John S. Mulchaey, and Jack F. Gallimore. Radio structures of seyfert galaxies. VIII. a distance- and magnitude-limited sample of early-type galaxies . ApJS , 120 pp. 209–245, February 1999.
- [veron-cetty_catalogue_2010] M.-P. Véron-Cetty and P. Véron. A catalogue of quasars and active nuclei: 13th edition . A&A , 518 pp. 10, July 2010.
Images
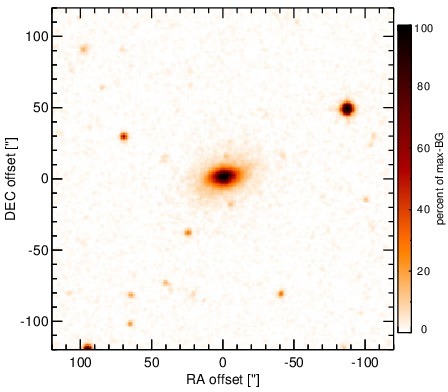
Optical image (DSS, red filter). Displayed are the central 4 arcmin with North being up and East to the left. The colour scaling is linear with white corresponding to the median background (BG) and black to the 0.01% pixels with the highest intensity.
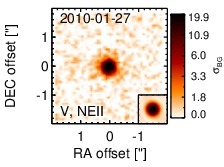
Subarcsecond-resolution MIR images sorted by increasing filter central wavelength. Displayed are the inner 4 arcsec with North being up and East to the left. The colour scaling is logarithmic with white corresponding to median BG and black to the 75% of the highest intensity of all images in units of sig_bg. The inset image (where present; either bottom or top right) shows the central arcsecond of the PSF from the calibrator star, scaled to match the science target. The labels in the bottom left state instrument and filter names (C: COMICS, M: Michelle, T: T-ReCS, V: VISIR).
SEDs
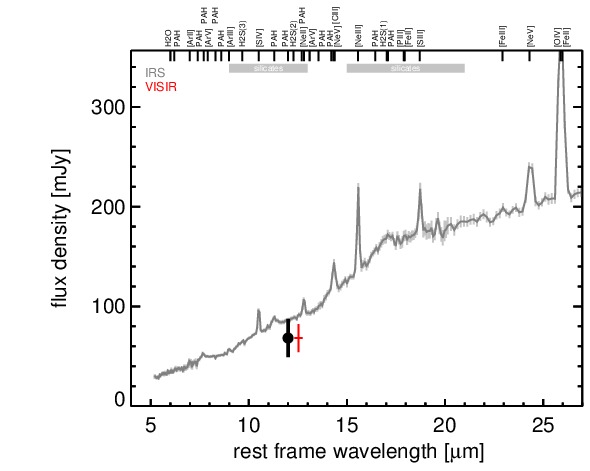
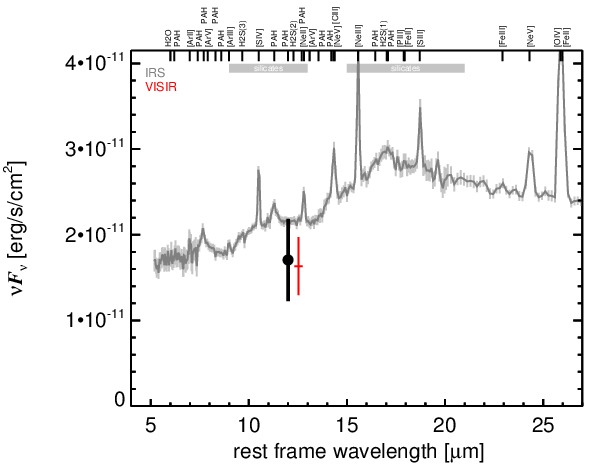
MIR SED. The description of the symbols in all the SED plots (where present) is the following: Grey crosses and solid lines mark the Spitzer/IRAC, MIPS and IRS data. The colour coding of the other symbols is as follows: green for COMICS, magenta for Michelle, blue for T-ReCS and red for VISIR data. Darker-coloured solid lines mark spectra of the corresponding instrument. The black filled circles mark the nuclear 12 and 18 micron continuum emission estimate from the data (where present). The ticks on the top axis mark positions of common MIR emission lines, while the light grey horizontal bars mark wavelength ranges affected by the silicate 10 and 18 micron features.