Sasmirala Individual Information for NGC 4235
Description
NGC 4235 is a nearly edge-on spiral galaxy at a redshift of z = 0.008 (D ~ 41.2 Mpc) with a Sy 1.2 nucleus [veron-cetty_catalogue_2010], which is detected but appears unresolved at radio wavelengths [ulvestad_radio_1984, kukula_high-resolution_1995]. The NLR appears compact with a possible [O III] extension towards the north-east with a PA~ 48∘ and a length of ~ 4.4arcsec ~ 0.9 kpc [pogge_circumnuclear_1989]. The first N-band detection of NGC 4235 is reported in [maiolino_new_1995]. In addition, Spitzer/IRAC, IRS and MIPS data are available and the corresponding images show a compact nucleus embedded within weak host emission. The IRS LR staring-mode spectrum suffers from a low S/N but indicates silicate 10 and 18 μm emission, very weak PAH emission and a blue spectral slope in νFν-space. Therefore, star formation seems to be at best weak on arcsecond scales. The MIR emission lines have been measured by [weaver_mid-infrared_2010] and [pereira-santaella_mid-infrared_2010]. We observed the nuclear region of NGC 4235 with VISIR in two narrow N-band filters in 2009 [asmus_mid-infrared_2011] and followed up with two additional N and one Q-band filter images in 2010. In all cases, the nucleus appears as a point source without any further host emission being detected. Our reanalysis of the published images is consistent with previously reported flux values, while the VISIR photometry in general is consistent with the Spitzer spectrophotometry.
- [asmus_mid-infrared_2011] D. Asmus, P. Gandhi, A. Smette, S. F. Hönig, and W. J. Duschl. Mid-infrared properties of nearby low-luminosity AGN at high angular resolution . A&A , 536 pp. 36, December 2011.
- [kukula_high-resolution_1995] Marek J. Kukula, Alan Pedlar, Stefi A. Baum, and Christopher P. O'Dea. High-resolution radio observations of the CfA seyfert sample -i. the observations . MNRAS , 276 pp. 1262–1280, October 1995.
- [maiolino_new_1995] R. Maiolino, M. Ruiz, G. H. Rieke, and L. D. Keller. New constraints on the unified model of seyfert galaxies . ApJ , 446 pp. 561, June 1995.
- [pereira-santaella_mid-infrared_2010] Miguel Pereira-Santaella, Aleksandar M. Diamond-Stanic, Almudena Alonso-Herrero, and George H. Rieke. The mid-infrared high-ionization lines from active galactic nuclei and star-forming galaxies . ApJ , 725 pp. 2270–2280, December 2010.
- [pogge_circumnuclear_1989] Richard W. Pogge. The circumnuclear environment of nearby, noninteracting seyfert galaxies . ApJ , 345 pp. 730–751, October 1989.
- [ulvestad_radio_1984] J. S. Ulvestad and A. S. Wilson. Radio structures of seyfert galaxies. VI - VLA observations of a nearby sample . ApJ , 285 pp. 439–452, October 1984.
- [veron-cetty_catalogue_2010] M.-P. Véron-Cetty and P. Véron. A catalogue of quasars and active nuclei: 13th edition . A&A , 518 pp. 10, July 2010.
- [weaver_mid-infrared_2010] K. A. Weaver, M. Meléndez, R. F. Mushotzky, S. Kraemer, K. Engle, E. Malumuth, J. Tueller, C. Markwardt, C. T. Berghea, R. P. Dudik, L. M. Winter, and L. Armus. Mid-infrared properties of the swift burst alert telescope active galactic nuclei sample of the local universe. i. emission-line diagnostics . ApJ , 716 pp. 1151–1165, June 2010.
Images
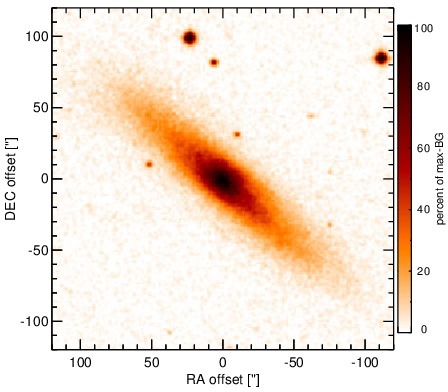
Optical image (DSS, red filter). Displayed are the central 4 arcmin with North being up and East to the left. The colour scaling is linear with white corresponding to the median background (BG) and black to the 0.01% pixels with the highest intensity.
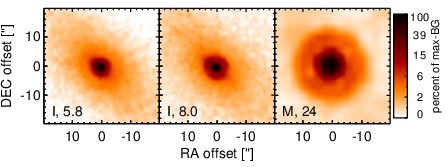
Spitzer MIR images. Displayed are the inner 40 arcsec with North being up and East to the left. The colour scaling is logarithmic with white corresponding to median BG and black to the 0.1% pixels with the highest intensity. The label in the bottom left states instrument and central wavelength of the filter in micron (I: IRAC, M: MIPS).
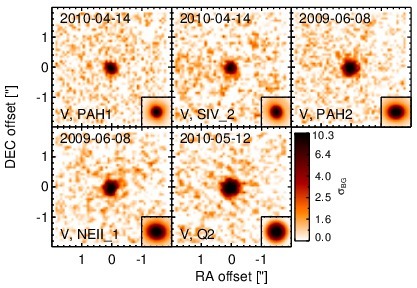
Subarcsecond-resolution MIR images sorted by increasing filter central wavelength. Displayed are the inner 4 arcsec with North being up and East to the left. The colour scaling is logarithmic with white corresponding to median BG and black to the 75% of the highest intensity of all images in units of sig_bg. The inset image (where present; either bottom or top right) shows the central arcsecond of the PSF from the calibrator star, scaled to match the science target. The labels in the bottom left state instrument and filter names (C: COMICS, M: Michelle, T: T-ReCS, V: VISIR).
SEDs
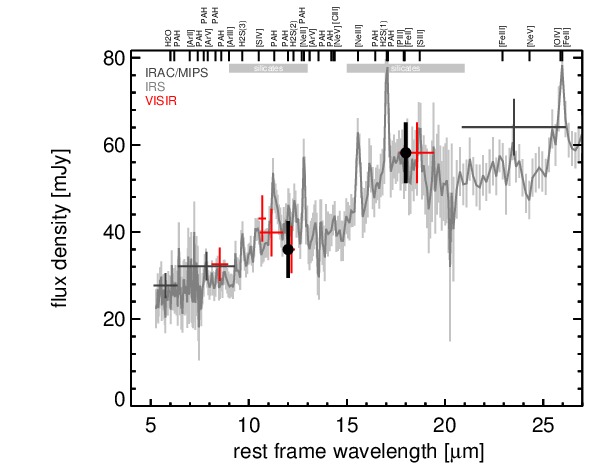
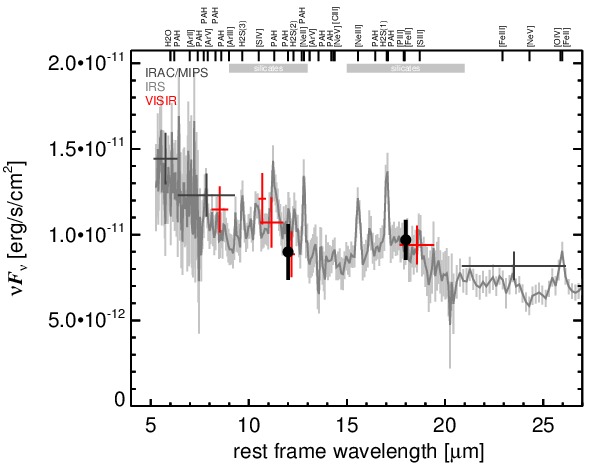
MIR SED. The description of the symbols in all the SED plots (where present) is the following: Grey crosses and solid lines mark the Spitzer/IRAC, MIPS and IRS data. The colour coding of the other symbols is as follows: green for COMICS, magenta for Michelle, blue for T-ReCS and red for VISIR data. Darker-coloured solid lines mark spectra of the corresponding instrument. The black filled circles mark the nuclear 12 and 18 micron continuum emission estimate from the data (where present). The ticks on the top axis mark positions of common MIR emission lines, while the light grey horizontal bars mark wavelength ranges affected by the silicate 10 and 18 micron features.