Sasmirala Individual Information for NGC 4258
Description
NGC 4258 is an inclined grand-design spiral galaxy at a distance of D = 7.6 ± 0.8 Mpc (NED redshift-independent median) with a weak Sy 2 nucleus [veron-cetty_catalogue_2010], a radio jet [ford_bubbles_1986], and a famous water maser (e.g., [nakai_extremely-high-velocity_1993, greenhill_detection_1995, herrnstein_vlba_1998]), allowing for accurate determination of the mass of the SMBH. [yuan_ngc_2002] present a detailed study of the AGN in NGC 4258. The first MIR observations of the nucleus were performed by [rieke_10_1978] and [dyck_photometry_1978] and first subarcsecond-resolution N- and Q-band images were taken with Keck/MIRLIN in 1998 [chary_high-resolution_2000]. A point-like nucleus (FWHM,0.5arcsec) without any other emission sources in the central 6arcsec is visible in the images. In the lower angular resolution Spitzer/IRAC and MIPS images on the other hand, spiral-like host emission surrounding the nucleus was detected. Because we measure the nuclear component only, our IRAC 5.8 and 8.0 μm and MIPS 24 μm fluxes are much lower than in [dale_spitzer_2009]. The Spitzer/IRS LR staring-mode spectrum exhibits silicate 10 and 18 μm emission, a PAH 11.3 μm feature and a flat spectral slope in νFν-space. We observed NGC 4258 with Michelle in two N-band filters in 2010, and additional Michelle N-band imaging in two more N-band filters was carried out in 2011 (unpublished, to our knowledge). Similar to the Keck imaging, only a compact MIR nucleus was detected in all the Michelle images. The nucleus appears marginally resolved in the Si-4 filter image (FWHM ~ 0.46arcsec ~ 17 pc) but not in the Si-5 images. Therefore, it remains uncertain, whether the nucleus is in general resolved at subarcsecond resolution in the MIR. Our nuclear photometry is on average ~ 22% lower than the Spitzer spectrophotometry, while the silicate 10 μm emission feature remains roughly similar in strength at subarcsecond resolution. Therefore, we can correct our 12 μm emission estimate for the silicate feature.
- [chary_high-resolution_2000] R. Chary, E. E. Becklin, A. S. Evans, G. Neugebauer, N. Z. Scoville, K. Matthews, and M. E. Ressler. High-resolution infrared imaging of the compact nuclear source in NGC 4258 . ApJ , 531 pp. 756–763, March 2000.
- [dale_spitzer_2009] D. A. Dale, J. D. T. Smith, E. A. Schlawin, L. Armus, B. A. Buckalew, S. A. Cohen, G. Helou, T. H. Jarrett, L. C. Johnson, J. Moustakas, E. J. Murphy, H. Roussel, K. Sheth, S. Staudaher, C. Bot, D. Calzetti, C. W. Engelbracht, K. D. Gordon, D. J. Hollenbach, R. C. Kennicutt, and S. Malhotra. The spitzer infrared nearby galaxies survey: A high-resolution spectroscopy anthology . ApJ , 693 pp. 1821–1834, March 2009.
- [dyck_photometry_1978] H. M. Dyck, E. E. Becklin, and R. W. Capps. Photometry of spiral galaxy nuclei at 10 μm and 20 μm . In BAAS , volume 10 of BAAS , page 422, March 1978.
- [ford_bubbles_1986] Holland C. Ford, Oved Dahari, George H. Jacoby, Patrick C. Crane, and Robin Ciardullo. Bubbles and braided jets in galaxies with compact radio nuclei . ApJL , 311 pp. L7–L11, December 1986.
- [greenhill_detection_1995] L. J. Greenhill, D. R. Jiang, J. M. Moran, M. J. Reid, K. Y. Lo, and M. J. Claussen. Detection of a subparsec diameter disk in the nucleus of NGC 4258 . ApJ , 440 pp. 619, February 1995.
- [herrnstein_vlba_1998] J. R. Herrnstein, L. J. Greenhill, J. M. Moran, P. J. Diamond, M. Inoue, N. Nakai, and M. Miyoshi. VLBA continuum observations of NGC 4258: Constraints on an advection-dominated accretion flow . ApJL , 497 pp. L69, April 1998.
- [nakai_extremely-high-velocity_1993] N. Nakai, M. Inoue, and M. Miyoshi. Extremely-high-velocity H2O maser emission in the galaxy NGC4258 . Nature , 361 pp. 45–47, January 1993.
- [rieke_10_1978] G. H. Rieke and M. J. Lebofsky. 10 micron observations of bright galaxies . ApJL , 220 pp. L37–L41, March 1978.
- [veron-cetty_catalogue_2010] M.-P. Véron-Cetty and P. Véron. A catalogue of quasars and active nuclei: 13th edition . A&A , 518 pp. 10, July 2010.
- [yuan_ngc_2002] F. Yuan, S. Markoff, H. Falcke, and P. L. Biermann. NGC 4258: A jet-dominated low-luminosity AGN? . A&A , 391 pp. 139–148, August 2002.
Images
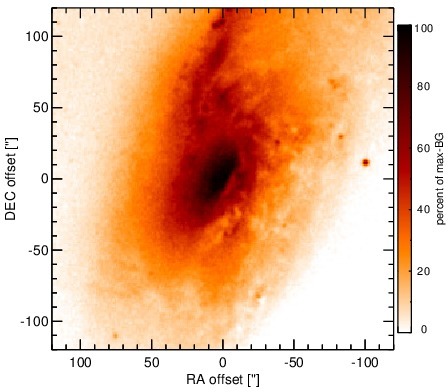
Optical image (DSS, red filter). Displayed are the central 4 arcmin with North being up and East to the left. The colour scaling is linear with white corresponding to the median background (BG) and black to the 0.01% pixels with the highest intensity.
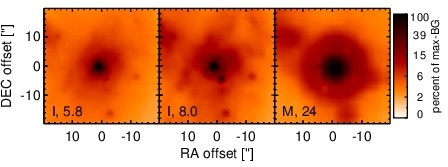
Spitzer MIR images. Displayed are the inner 40 arcsec with North being up and East to the left. The colour scaling is logarithmic with white corresponding to median BG and black to the 0.1% pixels with the highest intensity. The label in the bottom left states instrument and central wavelength of the filter in micron (I: IRAC, M: MIPS).
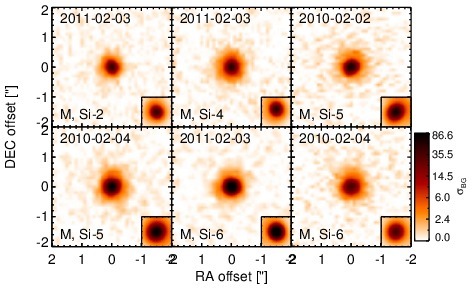
Subarcsecond-resolution MIR images sorted by increasing filter central wavelength. Displayed are the inner 4 arcsec with North being up and East to the left. The colour scaling is logarithmic with white corresponding to median BG and black to the 75% of the highest intensity of all images in units of sig_bg. The inset image (where present; either bottom or top right) shows the central arcsecond of the PSF from the calibrator star, scaled to match the science target. The labels in the bottom left state instrument and filter names (C: COMICS, M: Michelle, T: T-ReCS, V: VISIR).
SEDs
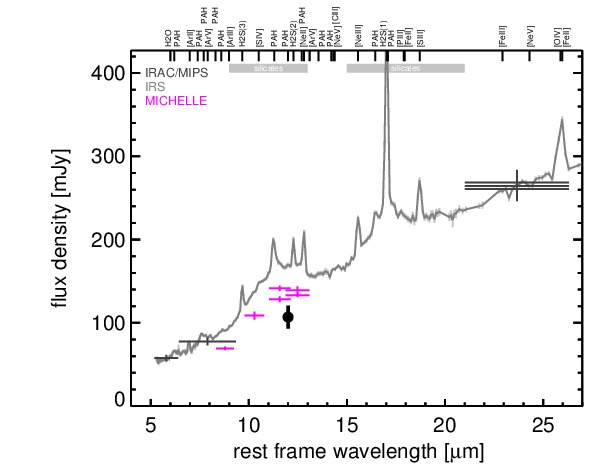
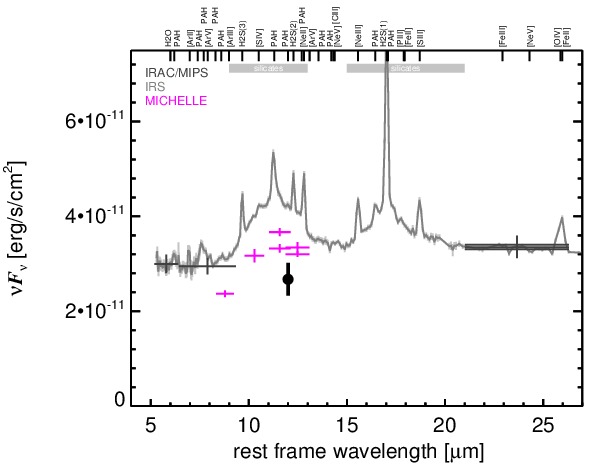
MIR SED. The description of the symbols in all the SED plots (where present) is the following: Grey crosses and solid lines mark the Spitzer/IRAC, MIPS and IRS data. The colour coding of the other symbols is as follows: green for COMICS, magenta for Michelle, blue for T-ReCS and red for VISIR data. Darker-coloured solid lines mark spectra of the corresponding instrument. The black filled circles mark the nuclear 12 and 18 micron continuum emission estimate from the data (where present). The ticks on the top axis mark positions of common MIR emission lines, while the light grey horizontal bars mark wavelength ranges affected by the silicate 10 and 18 micron features.