Sasmirala Individual Information for NGC 4261
Description
NGC 4261 is a radio-loud elliptical galaxy in the Virgo cluster at a distance of D = 31.7 ± 3.2 Mpc (NED redshift-independent median) with a FR I radio morphology and a LINER nucleus with polarized broad emission lines [barth_polarized_1999]. It features a compact radio core and a pair of symmetric jets extending east-west (PA~ 88∘; [birkinshaw_orientations_1985, jones_vlba_1997]), which are also visible in UV and X-ray images [chiaberge_what_2003, zezas_chandra_2005]. In addition to a compact NLR, a nearly edge-on nuclear dust disc roughly perpendicular to the jet axis was imaged (diameter~ 1.7arcsec ~ 262 pc; PA~-16∘; [jaffe_large_1993, jaffe_nuclear_1996]). The first N-band detection of NGC 4261 was reported by [impey_infrared_1986], followed up by ISO [siebenmorgen_isocam_2004] and Spitzer/IRAC, IRS and MIPS observations. NGC 4261 appears as a compact nucleus in the corresponding IRAC and MIPS images, while the nucleus is embedded within elliptical host emission in the IRAC images. We measure the nuclear component which provides values in between the non-stellar and total flux values in [tang_infrared-red_2009]. The IRS LR staring-mode spectrum exhibits silicate 10 μm emission, a weak PAH 11.3 μm feature and a blue spectral slope in νFν-space (see also [leipski_spitzer_2009]). Therefore, the arcsecond-scale MIR SED is rather dominated by old-stellar and possibly AGN emission rather than star formation. The nuclear region of NGC 4261 was observed with COMICS in two N-band filters in 2005 (unpublished, to our knowledge), with T-ReCS in the Si2 filter in 2008 [mason_nuclear_2012], and with VISIR in total in six N and one Q-band filter in 2006 [van_der_wolk_dust_2010], 2009 [asmus_mid-infrared_2011] and 2010 (unpublished, to our knowledge). A compact MIR nucleus is weakly detected in the T-ReCS and VISIR images (except for PAH2_2), while it remained undetected in the COMICS images. The low S/N of the images prohibits a quantitative extension analysis. Our remeasured nuclear fluxes agree with the previous publications except for the SIC measurement as discussed already in [asmus_mid-infrared_2011]. The nuclear photometry is on average ~ 44% lower than the Spitzer spectrophotometry and has a red spectral slope, which suggests that the subarcsecond MIR SED is AGN-dominated with most of the host emission being resolved out. We note that, on the one hand, the SIC flux is significantly higher and the PAH2_2 and N11.7 upper limits are significantly lower than the rest of the nuclear photometry for unknown reasons.
- [asmus_mid-infrared_2011] D. Asmus, P. Gandhi, A. Smette, S. F. Hönig, and W. J. Duschl. Mid-infrared properties of nearby low-luminosity AGN at high angular resolution . A&A , 536 pp. 36, December 2011.
- [barth_polarized_1999] Aaron J. Barth, Alexei V. Filippenko, and Edward C. Moran. Polarized broad-line emission from low-luminosity active galactic nuclei . ApJ , 525 pp. 673–684, November 1999.
- [birkinshaw_orientations_1985] M. Birkinshaw and R. L. Davies. The orientations of the rotation axes of radio galaxies. i - radio morphologies of bright elliptical galaxies . ApJ , 291 pp. 32–44, April 1985.
- [chiaberge_what_2003] Marco Chiaberge, Roberto Gilli, F. Duccio Macchetto, William B. Sparks, and Alessandro Capetti. What do the hubble space telescope and chandra tell us about the jet and the nuclear region of the radio galaxy 3C 270? . ApJ , 582 pp. 645–653, January 2003.
- [impey_infrared_1986] C. D. Impey, C. G. Wynn-Williams, and E. E. Becklin. Infrared studies of elliptical galaxies. i - an optically selected sample . ApJ , 309 pp. 572–592, October 1986.
- [jaffe_large_1993] Walter Jaffe, Holland C. Ford, Laura Ferrarese, Frank van den Bosch, and Robert W. O'Connell. A large nuclear accretion disk in the active galaxy NGC4261 . Nature , 364 pp. 213–215, July 1993.
- [jaffe_nuclear_1996] Walter Jaffe, Holland Ford, Laura Ferrarese, Frank van den Bosch, and Robert W. O'Connell. The nuclear disk of NGC 4261: Hubble space telescope images and ground-based spectra . ApJ , 460 pp. 214, March 1996.
- [jones_vlba_1997] Dayton L. Jones and Ann E. Wehrle. VLBA imaging of NGC 4261: Symmetric parsec-scale jets and the inner accretion region . ApJ , 484 pp. 186, July 1997.
- [leipski_spitzer_2009] C. Leipski, R. Antonucci, P. Ogle, and D. Whysong. The spitzer view of FR i radio galaxies: On the origin of the nuclear mid-infrared continuum . ApJ , 701 pp. 891–914, August 2009.
- [mason_nuclear_2012] R. E. Mason, E. Lopez-Rodriguez, C. Packham, A. Alonso-Herrero, N. A. Levenson, J. Radomski, C. Ramos Almeida, L. Colina, M. Elitzur, I. Aretxaga, P. F. Roche, and N. Oi. The nuclear infrared emission of low-luminosity active galactic nuclei. AJ , 144 pp. 11, July 2012.
- [siebenmorgen_isocam_2004] R. Siebenmorgen, W. Freudling, E. Krügel, and M. Haas. ISOCAM survey and dust models of 3CR radio galaxies and quasars . A&A , 421 pp. 129–145, July 2004.
- [tang_infrared-red_2009] Yuping Tang, Q.-S. Gu, J.-S. Huang, and Y.-P. Wang. Infrared-red cores in nearby elliptical galaxies . MNRAS , 397 pp. 1966–1975, August 2009.
- [van_der_wolk_dust_2010] G. van der Wolk, P. D. Barthel, R. F. Peletier, and J. W. Pel. Dust tori in radio galaxies . A&A , 511 pp. 64, February 2010.
- [zezas_chandra_2005] A. Zezas, M. Birkinshaw, D. M. Worrall, A. Peters, and G. Fabbiano. Chandra observations of NGC 4261 (3C 270): Revealing the jet and hidden active galactic nucleus in a type 2 LINER . ApJ , 627 pp. 711–720, July 2005.
Images
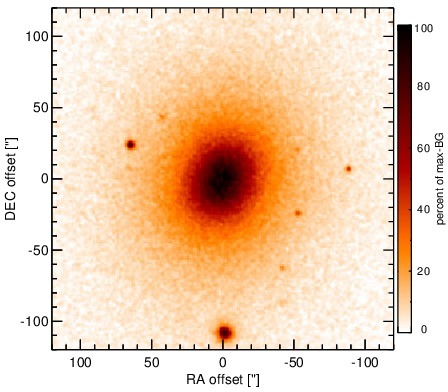
Optical image (DSS, red filter). Displayed are the central 4 arcmin with North being up and East to the left. The colour scaling is linear with white corresponding to the median background (BG) and black to the 0.01% pixels with the highest intensity.
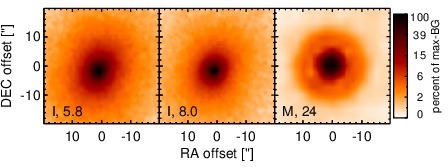
Spitzer MIR images. Displayed are the inner 40 arcsec with North being up and East to the left. The colour scaling is logarithmic with white corresponding to median BG and black to the 0.1% pixels with the highest intensity. The label in the bottom left states instrument and central wavelength of the filter in micron (I: IRAC, M: MIPS).
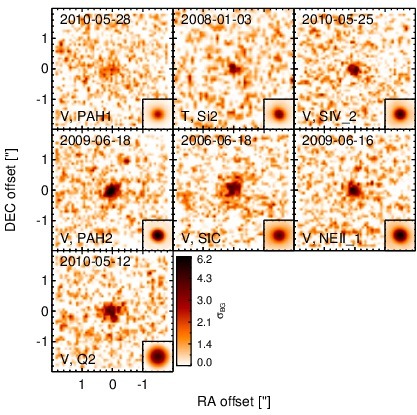
Subarcsecond-resolution MIR images sorted by increasing filter central wavelength. Displayed are the inner 4 arcsec with North being up and East to the left. The colour scaling is logarithmic with white corresponding to median BG and black to the 75% of the highest intensity of all images in units of sig_bg. The inset image (where present; either bottom or top right) shows the central arcsecond of the PSF from the calibrator star, scaled to match the science target. The labels in the bottom left state instrument and filter names (C: COMICS, M: Michelle, T: T-ReCS, V: VISIR).
SEDs
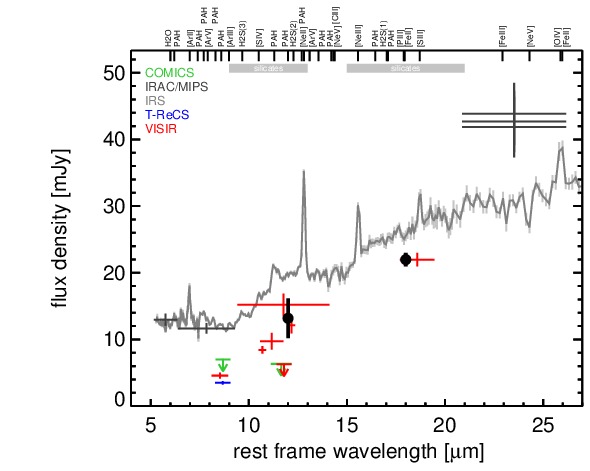
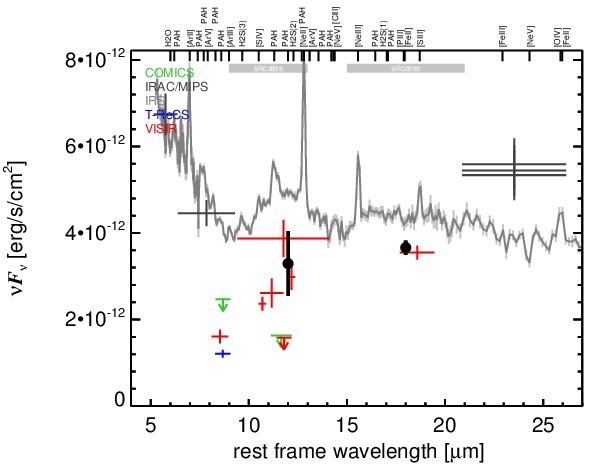
MIR SED. The description of the symbols in all the SED plots (where present) is the following: Grey crosses and solid lines mark the Spitzer/IRAC, MIPS and IRS data. The colour coding of the other symbols is as follows: green for COMICS, magenta for Michelle, blue for T-ReCS and red for VISIR data. Darker-coloured solid lines mark spectra of the corresponding instrument. The black filled circles mark the nuclear 12 and 18 micron continuum emission estimate from the data (where present). The ticks on the top axis mark positions of common MIR emission lines, while the light grey horizontal bars mark wavelength ranges affected by the silicate 10 and 18 micron features.