Sasmirala Individual Information for NGC 4303
Description
NGC 4303 is a face-on grand-design spiral galaxy in the Virgo cluster at a distance of D = 15.2 ± 3.1 Mpc [tully_nearby_1988] with an active nucleus classified either as a H II [ho_search_1997-1] or as a Sy 2 [veron-cetty_catalogue_2010]. The nucleus contains a young super-star cluster, which appears to be the primary source of the ionizing radiation [colina_detection_2002] with the presence of a weak AGN still possible [jimenez-bailon_nuclear_2003]. Therefore, we conservatively treat this object as an uncertain AGN. The first N-band photometry of NGC 4303 was performed by [kleinmann_observations_1970], [rieke_infrared_1972] and [rieke_10_1978], followed by IRTF observations in 1980-82 [scoville_10_1983, cizdziel_multiaperture_1985]. All these measurements turn out to be dominated by circum-nuclear emission, which is visible in the Spitzer/IRAC and MIPS images in addition to the large scale spiral structure. No unresolved component can be clearly distinguished from the nuclear MIR emission. Only the shortest wavelength setting of the IRS LR mapping-mode spectrum is available for NGC 4303. It roughly matches the IRAC photometry and indicates strong PAH emission, i.e., star formation in the central 4arcsec~ 300 pc region. We observed the nucleus of NGC 4303 with VISIR in 2006 in the NEII_1 filter [horst_mid_2008]. In our careful reanalysis of the data, we found the a compact MIR nucleus weakly detected with a flux ten times lower than all previous photometry including Spitzer. The low S/N prevents any extension analysis. Because this MIR emission from the central ~ 30 pc is still more than an order of magnitude higher than expected from the MIR–X-ray correlation for AGN, it is probably dominated by the nuclear cluster (see also [asmus_mid-infrared_2011]).
- [asmus_mid-infrared_2011] D. Asmus, P. Gandhi, A. Smette, S. F. Hönig, and W. J. Duschl. Mid-infrared properties of nearby low-luminosity AGN at high angular resolution . A&A , 536 pp. 36, December 2011.
- [cizdziel_multiaperture_1985] P. J. Cizdziel, E. E. Becklin, and C. G. Wynn-Williams. Multiaperture infrared photometry of the nuclei of spiral galaxies . AJ , 90 pp. 731–735, May 1985.
- [colina_detection_2002] Luis Colina, Rosa Gonzalez Delgado, J. Miguel Mas-Hesse, and Claus Leitherer. Detection of a super-star cluster as the ionizing source in the low-luminosity active galactic nucleus NGC 4303 . ApJ , 579 pp. 545–553, November 2002.
- [ho_search_1997-1] Luis C. Ho, Alexei V. Filippenko, and Wallace L. W. Sargent. A search for ``Dwarf'' seyfert nuclei. III. spectroscopic parameters and properties of the host galaxies . ApJS , 112 pp. 315, October 1997.
- [horst_mid_2008] H. Horst, P. Gandhi, A. Smette, and W. J. Duschl. The mid IR - hard x-ray correlation in AGN and its implications for dusty torus models . A&A , 479 pp. 389–396, February 2008.
- [jimenez-bailon_nuclear_2003] E. Jiménez-Bailón, M. Santos-Lleó, J. M. Mas-Hesse, M. Guainazzi, L. Colina, M. Cerviño, and Rosa M. González Delgado. Nuclear activity and massive star formation in the low-luminosity active galactic nucleus NGC 4303: Chandra x-ray observations . ApJ , 593 pp. 127–141, August 2003.
- [kleinmann_observations_1970] D. E. Kleinmann and F. J. Low. Observations of infrared galaxies . ApJL , 159 pp. L165, March 1970.
- [rieke_10_1978] G. H. Rieke and M. J. Lebofsky. 10 micron observations of bright galaxies . ApJL , 220 pp. L37–L41, March 1978.
- [rieke_infrared_1972] G. H. Rieke and F. J. Low. Infrared photometry of extragalactic sources . ApJL , 176 pp. L95, September 1972.
- [scoville_10_1983] N. Z. Scoville, E. E. Becklin, J. S. Young, and R. W. Capps. A 10 micron survey of star formation in galactic nuclei virgo spiral galaxies . ApJ , 271 pp. 512–523, August 1983.
- [tully_nearby_1988] R. Brent Tully. Nearby galaxies catalog . Cambridge University Press, 1988.
- [veron-cetty_catalogue_2010] M.-P. Véron-Cetty and P. Véron. A catalogue of quasars and active nuclei: 13th edition . A&A , 518 pp. 10, July 2010.
Images
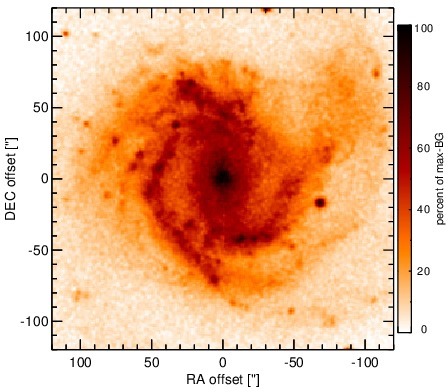
Optical image (DSS, red filter). Displayed are the central 4 arcmin with North being up and East to the left. The colour scaling is linear with white corresponding to the median background (BG) and black to the 0.01% pixels with the highest intensity.
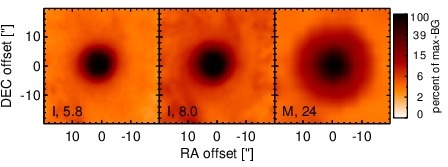
Spitzer MIR images. Displayed are the inner 40 arcsec with North being up and East to the left. The colour scaling is logarithmic with white corresponding to median BG and black to the 0.1% pixels with the highest intensity. The label in the bottom left states instrument and central wavelength of the filter in micron (I: IRAC, M: MIPS).
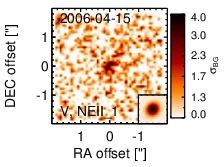
Subarcsecond-resolution MIR images sorted by increasing filter central wavelength. Displayed are the inner 4 arcsec with North being up and East to the left. The colour scaling is logarithmic with white corresponding to median BG and black to the 75% of the highest intensity of all images in units of sig_bg. The inset image (where present; either bottom or top right) shows the central arcsecond of the PSF from the calibrator star, scaled to match the science target. The labels in the bottom left state instrument and filter names (C: COMICS, M: Michelle, T: T-ReCS, V: VISIR).
SEDs
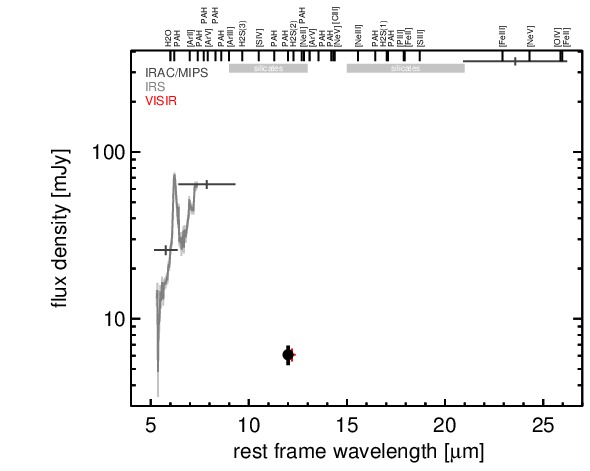
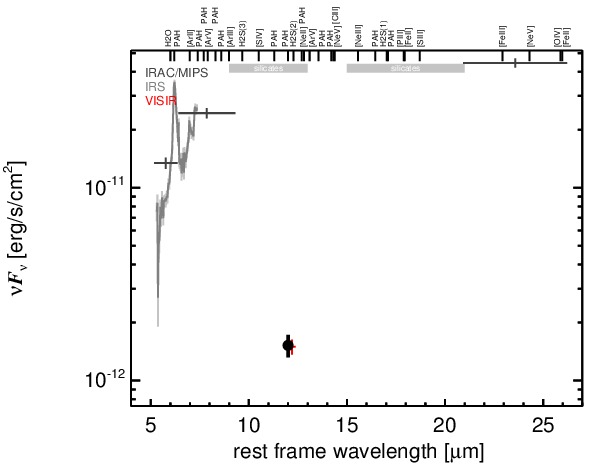
MIR SED. The description of the symbols in all the SED plots (where present) is the following: Grey crosses and solid lines mark the Spitzer/IRAC, MIPS and IRS data. The colour coding of the other symbols is as follows: green for COMICS, magenta for Michelle, blue for T-ReCS and red for VISIR data. Darker-coloured solid lines mark spectra of the corresponding instrument. The black filled circles mark the nuclear 12 and 18 micron continuum emission estimate from the data (where present). The ticks on the top axis mark positions of common MIR emission lines, while the light grey horizontal bars mark wavelength ranges affected by the silicate 10 and 18 micron features.