Sasmirala Individual Information for NGC 4395
Description
NGC 4395 is a close-by bulge-less dwarf spiral galaxy at a distance of D = 4.3 ± 1.1 Mpc (NED redshift-independent median) with a Sy 1.8 nucleus [veron-cetty_catalogue_2010] that belongs to nine-month BAT AGN sample. This AGN is the least-luminous type I AGN known [filippenko_discovery_1989, filippenko_hst_1993] and possesses one of the lowest central black hole masses in an AGN, too [filippenko_low-mass_2003, peterson_multiwavelength_2005]. It is highly variable at optical, UV and X-ray wavelengths (e.g., [cameron_correlated_2012]) and features a compact radio nucleus with a subparsec-scale outflow [moran_nuclear_1999, ho_radio_2001, wrobel_inner_2001, wrobel_radio_2006]. Furthermore, the AGN is embedded within a non-active elliptical nuclear star cluster with a diameter of ~ 0.4arcsec ~ 8 pc and a PA~ 255∘, and complex bended [O III] emission with ~ 1arcsec ~ 20 pc along a PA~ 270∘ [matthews_wfpc2_1999, filippenko_low-mass_2003]. The first N-band detection of NGC 4395 is reported in [maiolino_new_1995], which was followed up with ISO [bendo_infrared_2002] and Spitzer/IRAC, IRS and MIPS observations. The corresponding IRAC and MIPS images are dominated by a nuclear compact source, with the clumpy host emission being only weakly visible. Still, our nuclear IRAC 5.8 and 8.0 μm and MIPS 24 μm fluxes are significantly lower than the total fluxes published in [dale_spitzer_2009]. The IRS LR staring-mode spectrum exhibits very weak PAH features, prominent forbidden emission lines, and a red spectral slope in νFν-space (see also [marble_aromatic_2010, weaver_mid-infrared_2010, pereira-santaella_mid-infrared_2010]). We observed the nuclear region of NGC 4395 with Michelle in the Si-6 filter in 2010 and weakly detected a compact nucleus without further host emission. The nucleus appears marginally resolved (FWHM ~ 0.53arcsec ~ 11 pc). However, the current data are not sufficient for a robust classification of the nuclear extension in the MIR at subarcsecond scales. The nuclear photometry is ~ 50% lower than the Spitzer spectrophotometry. The current MIR data are not sufficient to characterize the properties of the nuclear MIR emission.
- [bendo_infrared_2002] George J. Bendo, Robert D. Joseph, Martyn Wells, Pascal Gallais, Martin Haas, Ana M. Heras, Ulrich Klaas, René J. Laureijs, Kieron Leech, Dietrich Lemke, Leo Metcalfe, Michael Rowan-Robinson, Bernhard Schulz, and Charles Telesco. An infrared space observatory atlas of bright spiral galaxies . AJ , 123 pp. 3067–3107, June 2002.
- [cameron_correlated_2012] D. T. Cameron, I. McHardy, T. Dwelly, E. Breedt, P. Uttley, P. Lira, and P. Arevalo. Correlated x-ray/ultraviolet/optical variability in the very low mass AGN NGC 4395 . MNRAS , 422 pp. 902–912, May 2012.
- [dale_spitzer_2009] D. A. Dale, J. D. T. Smith, E. A. Schlawin, L. Armus, B. A. Buckalew, S. A. Cohen, G. Helou, T. H. Jarrett, L. C. Johnson, J. Moustakas, E. J. Murphy, H. Roussel, K. Sheth, S. Staudaher, C. Bot, D. Calzetti, C. W. Engelbracht, K. D. Gordon, D. J. Hollenbach, R. C. Kennicutt, and S. Malhotra. The spitzer infrared nearby galaxies survey: A high-resolution spectroscopy anthology . ApJ , 693 pp. 1821–1834, March 2009.
- [filippenko_discovery_1989] Alexei V. Filippenko and Wallace L. W. Sargent. Discovery of an extremely low luminosity seyfert 1 nucleus in the dwarf galaxy NGC 4395 . ApJL , 342 pp. L11–L14, July 1989.
- [filippenko_hst_1993] Alexei V. Filippenko, Luis C. Ho, and Wallace L. W. Sargent. HST observations of NGC 4395, the least luminous seyfert 1 nucleus - evidence against the starburst hypothesis for broad-lined active galactic nuclei . ApJL , 410 pp. L75–L78, June 1993.
- [filippenko_low-mass_2003] Alexei V. Filippenko and Luis C. Ho. A low-mass central black hole in the bulgeless seyfert 1 galaxy NGC 4395 . ApJL , 588 pp. L13–L16, May 2003.
- [ho_radio_2001] Luis C. Ho and James S. Ulvestad. Radio continuum survey of an optically selected sample of nearby seyfert galaxies . ApJS , 133 pp. 77–118, March 2001.
- [maiolino_new_1995] R. Maiolino, M. Ruiz, G. H. Rieke, and L. D. Keller. New constraints on the unified model of seyfert galaxies . ApJ , 446 pp. 561, June 1995.
- [marble_aromatic_2010] A. R. Marble, C. W. Engelbracht, L. van Zee, D. A. Dale, J. D. T. Smith, K. D. Gordon, Y. Wu, J. C. Lee, R. C. Kennicutt, E. D. Skillman, L. C. Johnson, M. Block, D. Calzetti, S. A. Cohen, H. Lee, and M. D. Schuster. An aromatic inventory of the local volume . ApJ , 715 pp. 506–540, May 2010.
- [matthews_wfpc2_1999] Lynn D. Matthews, John S. Gallagher, John E. Krist, Alan M. Watson, Christopher J. Burrows, Richard E. Griffiths, J. Jeff Hester, John T. Trauger, Gilda E. Ballester, John T. Clarke, David Crisp, Robin W. Evans, John G. Hoessel, Jon A. Holtzman, Jeremy R. Mould, Paul A. Scowen, Karl R. Stapelfeldt, and James A. Westphal. WFPC2 observations of compact star cluster nuclei in low-luminosity spiral galaxies . AJ , 118 pp. 208–235, July 1999.
- [moran_nuclear_1999] Edward C. Moran, Alexei V. Filippenko, Luis C. Ho, Joseph C. Shields, Tomaso Belloni, Andrea Comastri, Steven L. Snowden, and Richard A. Sramek. The nuclear spectral energy distribution of NGC 4395, the least luminous type 1 seyfert galaxy . PASP , 111 pp. 801–808, July 1999.
- [pereira-santaella_mid-infrared_2010] Miguel Pereira-Santaella, Aleksandar M. Diamond-Stanic, Almudena Alonso-Herrero, and George H. Rieke. The mid-infrared high-ionization lines from active galactic nuclei and star-forming galaxies . ApJ , 725 pp. 2270–2280, December 2010.
- [peterson_multiwavelength_2005] Bradley M. Peterson, Misty C. Bentz, Louis-Benoit Desroches, Alexei V. Filippenko, Luis C. Ho, Shai Kaspi, Ari Laor, Dan Maoz, Edward C. Moran, Richard W. Pogge, and Alice C. Quillen. Multiwavelength monitoring of the dwarf seyfert 1 galaxy NGC 4395. i. a reverberation-based measurement of the black hole mass . ApJ , 632 pp. 799–808, October 2005.
- [veron-cetty_catalogue_2010] M.-P. Véron-Cetty and P. Véron. A catalogue of quasars and active nuclei: 13th edition . A&A , 518 pp. 10, July 2010.
- [weaver_mid-infrared_2010] K. A. Weaver, M. Meléndez, R. F. Mushotzky, S. Kraemer, K. Engle, E. Malumuth, J. Tueller, C. Markwardt, C. T. Berghea, R. P. Dudik, L. M. Winter, and L. Armus. Mid-infrared properties of the swift burst alert telescope active galactic nuclei sample of the local universe. i. emission-line diagnostics . ApJ , 716 pp. 1151–1165, June 2010.
- [wrobel_inner_2001] J. M. Wrobel, C. D. Fassnacht, and L. C. Ho. The inner light-year of the nearest seyfert 1 nucleus in NGC 4395 . ApJL , 553 pp. L23–L26, May 2001.
- [wrobel_radio_2006] J. M. Wrobel and L. C. Ho. Radio emission on subparsec scales from the intermediate-mass black hole in NGC 4395 . ApJL , 646 pp. L95–L98, August 2006.
Images
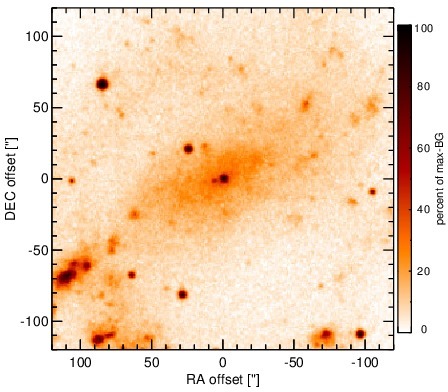
Optical image (DSS, red filter). Displayed are the central 4 arcmin with North being up and East to the left. The colour scaling is linear with white corresponding to the median background (BG) and black to the 0.01% pixels with the highest intensity.
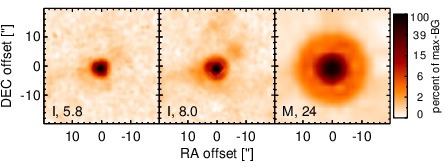
Spitzer MIR images. Displayed are the inner 40 arcsec with North being up and East to the left. The colour scaling is logarithmic with white corresponding to median BG and black to the 0.1% pixels with the highest intensity. The label in the bottom left states instrument and central wavelength of the filter in micron (I: IRAC, M: MIPS).
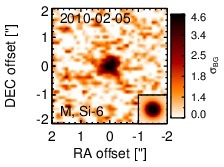
Subarcsecond-resolution MIR images sorted by increasing filter central wavelength. Displayed are the inner 4 arcsec with North being up and East to the left. The colour scaling is logarithmic with white corresponding to median BG and black to the 75% of the highest intensity of all images in units of sig_bg. The inset image (where present; either bottom or top right) shows the central arcsecond of the PSF from the calibrator star, scaled to match the science target. The labels in the bottom left state instrument and filter names (C: COMICS, M: Michelle, T: T-ReCS, V: VISIR).
SEDs
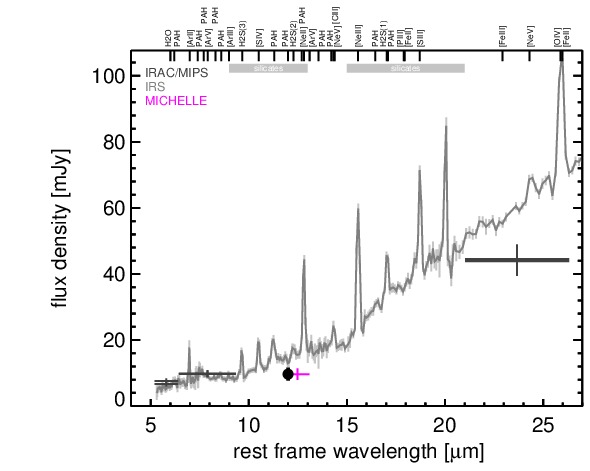
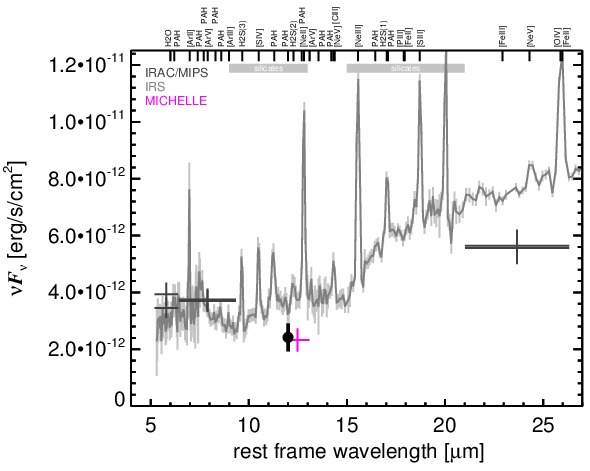
MIR SED. The description of the symbols in all the SED plots (where present) is the following: Grey crosses and solid lines mark the Spitzer/IRAC, MIPS and IRS data. The colour coding of the other symbols is as follows: green for COMICS, magenta for Michelle, blue for T-ReCS and red for VISIR data. Darker-coloured solid lines mark spectra of the corresponding instrument. The black filled circles mark the nuclear 12 and 18 micron continuum emission estimate from the data (where present). The ticks on the top axis mark positions of common MIR emission lines, while the light grey horizontal bars mark wavelength ranges affected by the silicate 10 and 18 micron features.