Sasmirala Individual Information for NGC 4438
Description
NGC 4438 is a highly-inclined disturbed spiral galaxy in the Virgo cluster at a distance of D = 13.7 ± 2.2 Mpc (NED redshift-independent median) with an active nucleus, which has initially be classified as a broad-line LINER [ho_search_1997-1]. However, [kenney_hubble_2002] point out that the LINER-like emission is actually not coming from the nucleus, which rather shows optical emission line ratios like an H II nucleus. Studies of the high-resolution X-ray emission regarding the existence of an AGN are not conclusive [machacek_chandra_2004, satyapal_link_2005, gonzalez-martin_x-ray_2006, gonzalez-martin_fitting_2009, flohic_central_2006]. The presence of an AGN is supported by the presence of a compact radio source with a jet-like extension of ~ 0.3arcsec ~ 20 pc along a PA~ 233∘ and two asymmetric radio lobes on kiloparsec scale [hummel_anomalous_1991, hota_ngc_2007]. The western side of the bipolar structure is also seen in Hα [kenney_hubble_2002]. We conservatively treat NGC 4438 as an uncertain AGN. Early ground-based MIR photometry was performed by [scoville_10_1983], [lonsdale_infrared_1984], and [lawrence_observations_1985], followed by ISO observations [boselli_mid-ir_1998, roussel_atlas_2001]. The first subarcsecond MIR image of NGC 4438 was obtained with ESO 3.6 m/TIMMI2 in 2002 [perez_near-infrared_2009] and shows a compact nucleus embedded in ~ 3.5arcsec ~ 230 pc extended emission along the galaxy major axis (PA~ 10∘). The Spitzer/IRAC and MIPS images show a comparable morphology but are dominated by extended host emission. The Spitzer/IRS LR staring-mode spectrum is dominated by strong PAH emission features with possibly weak silicate 10 μm absorption and a flat spectral slope in νFν-space (see also [mason_nuclear_2012]). Thus, the arcsecond-scale MIR SED is star-formation dominated. Note that [dudik_spitzer_2009] report the detection of the AGN-indicative [Ne V] emission line in the IRS spectrum. The nuclear region of NGC 4438 was observed with T-ReCS in the Si2 filter during two nights in 2008 [mason_nuclear_2012]. In both images, a compact nucleus is weakly detected. Extended emission seems to be visible to the eye but the low S/N prohibits a quantitative analysis. Our nuclear photometry is consistent with the PSF-flux reported in [mason_nuclear_2012] and ~ 83% lower than the Spitzer spectrophotometry. Therefore, we conclude that the central ~ 250 pc are completely dominated by star formation emission in the MIR, while the subarcsecond-scale results are consistent with both the presence of an AGN or a nuclear starburst.
- [boselli_mid-ir_1998] A. Boselli, J. Lequeux, M. Sauvage, O. Boulade, F. Boulanger, D. Cesarsky, C. Dupraz, S. Madden, F. Viallefond, and L. Vigroux. Mid-IR emission of galaxies in the virgo cluster. II. integrated properties . A&A , 335 pp. 53–68, July 1998.
- [dudik_spitzer_2009] R. P. Dudik, S. Satyapal, and D. Marcu. A spitzer spectroscopic survey of low-ionization nuclear emission-line regions: Characterization of the central source . ApJ , 691 pp. 1501–1524, February 2009.
- [flohic_central_2006] Hélène M. L. G. Flohic, Michael Eracleous, George Chartas, Joseph C. Shields, and Edward C. Moran. The central engines of 19 LINERs as viewed by chandra . ApJ , 647 pp. 140–160, August 2006.
- [gonzalez-martin_fitting_2009] O. González-Martín, J. Masegosa, I. Márquez, and M. Guainazzi. Fitting liner nuclei within the active galactic nucleus family: A matter of obscuration? . ApJ , 704 pp. 1570–1585, October 2009.
- [gonzalez-martin_x-ray_2006] O. González-Martín, J. Masegosa, I. Márquez, M. A. Guerrero, and D. Dultzin-Hacyan. X-ray nature of the LINER nuclear sources . A&A , 460 pp. 45–57, December 2006.
- [ho_search_1997-1] Luis C. Ho, Alexei V. Filippenko, and Wallace L. W. Sargent. A search for ``Dwarf'' seyfert nuclei. III. spectroscopic parameters and properties of the host galaxies . ApJS , 112 pp. 315, October 1997.
- [hota_ngc_2007] Ananda Hota, D. J. Saikia, and Judith A. Irwin. NGC 4438 and its environment at radio wavelengths . MNRAS , 380 pp. 1009–1022, September 2007.
- [hummel_anomalous_1991] E. Hummel and D. J. Saikia. The anomalous radio features in NGC 4388 and NGC 4438 . A&A , 249 pp. 43–56, September 1991.
- [kenney_hubble_2002] Jeffrey D. P. Kenney and Elizabeth E. Yale. Hubble space telescope imaging of bipolar nuclear shells in the disturbed virgo cluster galaxy NGC 4438 . ApJ , 567 pp. 865–874, March 2002.
- [lawrence_observations_1985] A. Lawrence, M. Ward, M. Elvis, G. Fabbiano, S. P. Willner, N. P. Carleton, and A. Longmore. Observations from 1 to 20 microns of low-luminosity active galaxies . ApJ , 291 pp. 117–127, April 1985.
- [lonsdale_infrared_1984] C. J. Lonsdale, S. E. Persson, and K. Matthews. Infrared observations of interacting/merging galaxies . ApJ , 287 pp. 95–107, December 1984.
- [machacek_chandra_2004] Marie E. Machacek, Christine Jones, and William R. Forman. Chandra observations of NGC 4438: An environmentally damaged galaxy in the virgo cluster . ApJ , 610 pp. 183–200, July 2004.
- [mason_nuclear_2012] R. E. Mason, E. Lopez-Rodriguez, C. Packham, A. Alonso-Herrero, N. A. Levenson, J. Radomski, C. Ramos Almeida, L. Colina, M. Elitzur, I. Aretxaga, P. F. Roche, and N. Oi. The nuclear infrared emission of low-luminosity active galactic nuclei. AJ , 144 pp. 11, July 2012.
- [perez_near-infrared_2009] Sebastian Perez, Simon Casassus, Juan R. Cortés, and Jeffrey D. P. Kenney. Near-infrared imaging and spectroscopy of the nuclear region of the disturbed virgo cluster spiral NGC4438 . MNRAS , 400 pp. 2098–2110, December 2009.
- [roussel_atlas_2001] H. Roussel, L. Vigroux, A. Bosma, M. Sauvage, C. Bonoli, P. Gallais, T. Hawarden, J. Lequeux, S. Madden, and P. Mazzei. An atlas of mid-infrared dust emission in spiral galaxies . A&A , 369 pp. 473–509, April 2001.
- [satyapal_link_2005] S. Satyapal, R. P. Dudik, B. O'Halloran, and M. Gliozzi. The link between star formation and accretion in LINERs: a comparison with other active galactic nucleus subclasses . ApJ , 633 pp. 86–104, November 2005.
- [scoville_10_1983] N. Z. Scoville, E. E. Becklin, J. S. Young, and R. W. Capps. A 10 micron survey of star formation in galactic nuclei virgo spiral galaxies . ApJ , 271 pp. 512–523, August 1983.
Images
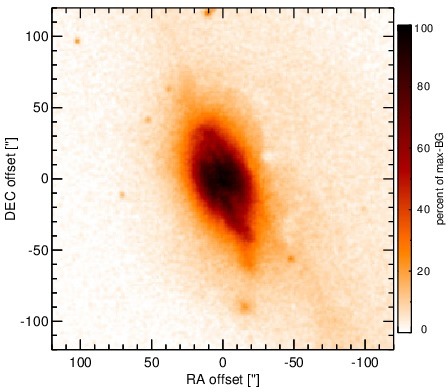
Optical image (DSS, red filter). Displayed are the central 4 arcmin with North being up and East to the left. The colour scaling is linear with white corresponding to the median background (BG) and black to the 0.01% pixels with the highest intensity.
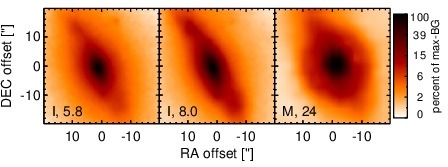
Spitzer MIR images. Displayed are the inner 40 arcsec with North being up and East to the left. The colour scaling is logarithmic with white corresponding to median BG and black to the 0.1% pixels with the highest intensity. The label in the bottom left states instrument and central wavelength of the filter in micron (I: IRAC, M: MIPS).
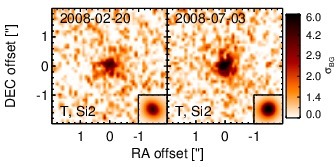
Subarcsecond-resolution MIR images sorted by increasing filter central wavelength. Displayed are the inner 4 arcsec with North being up and East to the left. The colour scaling is logarithmic with white corresponding to median BG and black to the 75% of the highest intensity of all images in units of sig_bg. The inset image (where present; either bottom or top right) shows the central arcsecond of the PSF from the calibrator star, scaled to match the science target. The labels in the bottom left state instrument and filter names (C: COMICS, M: Michelle, T: T-ReCS, V: VISIR).
SEDs
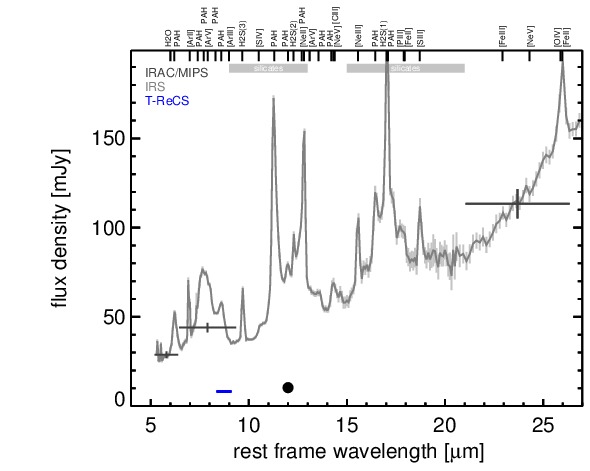
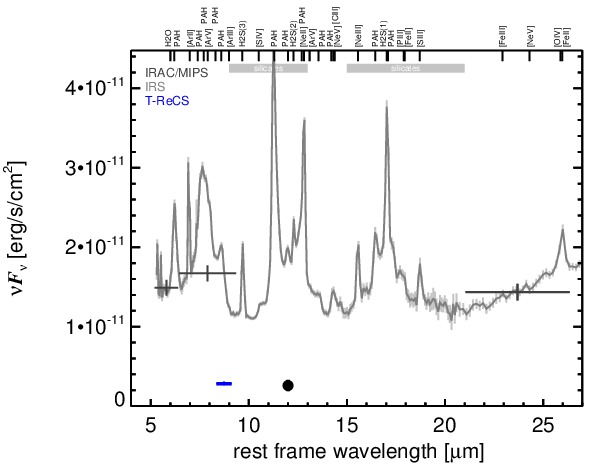
MIR SED. The description of the symbols in all the SED plots (where present) is the following: Grey crosses and solid lines mark the Spitzer/IRAC, MIPS and IRS data. The colour coding of the other symbols is as follows: green for COMICS, magenta for Michelle, blue for T-ReCS and red for VISIR data. Darker-coloured solid lines mark spectra of the corresponding instrument. The black filled circles mark the nuclear 12 and 18 micron continuum emission estimate from the data (where present). The ticks on the top axis mark positions of common MIR emission lines, while the light grey horizontal bars mark wavelength ranges affected by the silicate 10 and 18 micron features.