Sasmirala Individual Information for NGC 4472
Description
NGC 4472 is an elliptical galaxy in the Virgo cluster at a distance of D = 17.1 Mpc [mei_acs_2007] with possibly a Sy 2 or LINER nucleus ([ho_search_1997-1]; NED). A nuclear radio point source supports the existence of an AGN in this object [anderson_size_2005], while the X-ray data remains inconclusive so far [maccarone_low-mass_2003]. Apart from IRAS, NGC 4472 was observed with IRTF [impey_infrared_1986] but was not unambiguously detected. ISO/ISOCAM [ferrari_survey_2002] and Spitzer/IRAC, IRS and MIPS observations were performed subsequently. In the IRAC and MIPS images, extended elliptical emission without any clear unresolved nucleus was detected. Therefore, our IRAC 5.8 and 8.0 μm and MIPS 24 μm photometry of the central four-arcsecond region (seven for MIPS) is significantly lower than the values published in [temi_ages_2005]. The IRS LR staring spectrum is dominated by passive host emission with a blue slope in νFν-space, silicate 10 μm emission and no PAH features (see also [bregman_ages_2006]). We observed the nucleus of NGC 4472 with VISIR in the NEII_1 filter in 2006 but failed to detect any emission [horst_mid_2008]. Therefore, from the MIR point of view there is no clear evidence for the existence of an AGN in NGC 4472. However, the derived upper limit on the 12 μm continuum emission is not inconsistent with the existence of a faint AGN as expected from the MIR–X-ray correlation of AGN [asmus_mid-infrared_2011].
- [anderson_size_2005] James M. Anderson and James S. Ulvestad. The size of the radio-emitting region in low-luminosity active galactic nuclei . ApJ , 627 pp. 674–700, July 2005.
- [asmus_mid-infrared_2011] D. Asmus, P. Gandhi, A. Smette, S. F. Hönig, and W. J. Duschl. Mid-infrared properties of nearby low-luminosity AGN at high angular resolution . A&A , 536 pp. 36, December 2011.
- [bregman_ages_2006] Joel N. Bregman, Pasquale Temi, and Jesse D. Bregman. The ages of elliptical galaxies from infrared spectral energy distributions . ApJ , 647 pp. 265–275, August 2006.
- [ferrari_survey_2002] F. Ferrari, M. G. Pastoriza, F. D. Macchetto, C. Bonatto, N. Panagia, and W. B. Sparks. Survey of the ISM in early-type galaxies. IV. the hot dust component . A&A , 389 pp. 355–366, July 2002.
- [ho_search_1997-1] Luis C. Ho, Alexei V. Filippenko, and Wallace L. W. Sargent. A search for ``Dwarf'' seyfert nuclei. III. spectroscopic parameters and properties of the host galaxies . ApJS , 112 pp. 315, October 1997.
- [horst_mid_2008] H. Horst, P. Gandhi, A. Smette, and W. J. Duschl. The mid IR - hard x-ray correlation in AGN and its implications for dusty torus models . A&A , 479 pp. 389–396, February 2008.
- [impey_infrared_1986] C. D. Impey, C. G. Wynn-Williams, and E. E. Becklin. Infrared studies of elliptical galaxies. i - an optically selected sample . ApJ , 309 pp. 572–592, October 1986.
- [maccarone_low-mass_2003] Thomas J. Maccarone, Arunav Kundu, and Stephen E. Zepf. The low-mass x-ray binary-globular cluster connection. II. NGC 4472 x-ray source properties and source catalogs . ApJ , 586 pp. 814–825, April 2003.
- [mei_acs_2007] Simona Mei, John P. Blakeslee, Patrick Côté, John L. Tonry, Michael J. West, Laura Ferrarese, Andrés Jordán, Eric W. Peng, André Anthony, and David Merritt. The ACS virgo cluster survey. XIII. SBF distance catalog and the three-dimensional structure of the virgo cluster . ApJ , 655 pp. 144–162, January 2007.
- [temi_ages_2005] Pasquale Temi, William G. Mathews, and Fabrizio Brighenti. The ages of elliptical galaxies from mid-infrared emission . ApJ , 622 pp. 235–243, March 2005.
Images
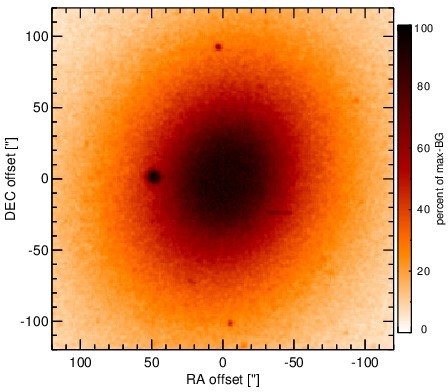
Optical image (DSS, red filter). Displayed are the central 4 arcmin with North being up and East to the left. The colour scaling is linear with white corresponding to the median background (BG) and black to the 0.01% pixels with the highest intensity.
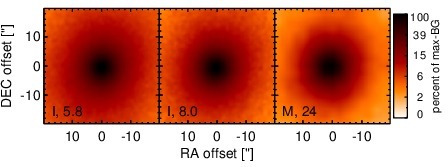
Spitzer MIR images. Displayed are the inner 40 arcsec with North being up and East to the left. The colour scaling is logarithmic with white corresponding to median BG and black to the 0.1% pixels with the highest intensity. The label in the bottom left states instrument and central wavelength of the filter in micron (I: IRAC, M: MIPS).
SEDs
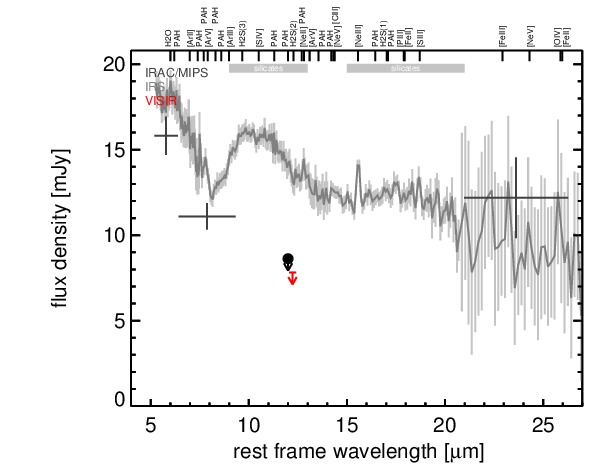
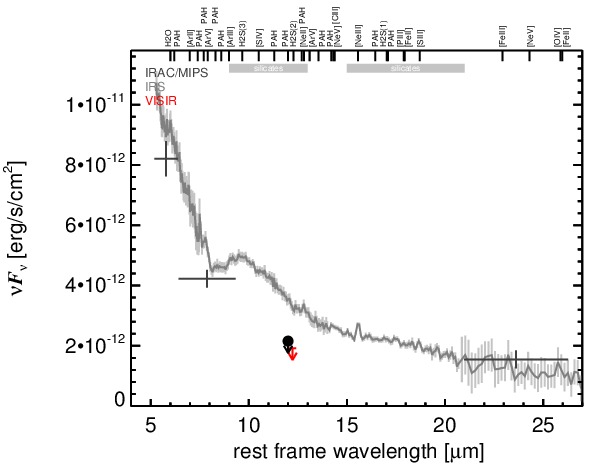
MIR SED. The description of the symbols in all the SED plots (where present) is the following: Grey crosses and solid lines mark the Spitzer/IRAC, MIPS and IRS data. The colour coding of the other symbols is as follows: green for COMICS, magenta for Michelle, blue for T-ReCS and red for VISIR data. Darker-coloured solid lines mark spectra of the corresponding instrument. The black filled circles mark the nuclear 12 and 18 micron continuum emission estimate from the data (where present). The ticks on the top axis mark positions of common MIR emission lines, while the light grey horizontal bars mark wavelength ranges affected by the silicate 10 and 18 micron features.