Sasmirala Individual Information for NGC 4579
Description
NGC 4579 is a spiral galaxy in the Virgo cluster at a distance of D = 16.8 ± 3.4 Mpc [tully_nearby_1988] with an active nucleus classified as a broad-line LINER/Sy 1.9 transition nucleus [ho_search_1997-1]. A radio jet (PA~ 135∘) and star formation were detected in the nucleus [ulvestad_origin_2001, contini_complex_2004]. The first MIR observations of this object were performed with IRTF in 1980 [cizdziel_multiaperture_1985], in 1982 [scoville_10_1983] and in 1983 [lawrence_observations_1985]. After IRAS, NGC 4579 was observed with ISO/ISOCAM in 1996, and an unresolved nucleus was detected at 15 μm with resolved surrounding host emission [roussel_atlas_2001, ramos_almeida_mid-infrared_2007]. The same MIR morphology is evident in the Spitzer/IRAC and MIPS images. Because our IRAC 5.8 and 8.0 μm and MIPS 24 μm photometry encompasses only the nuclear flux, the values are significantly lower than previously published fluxes of the same data (e.g., [dale_infrared_2005, smith_spitzer_2007, munoz-mateos_radial_2009, gallimore_infrared_2010]). Owing to the complex emission morphology of NGC 4579 in the MIR, the IRS LR mapping-mode PBCD spectrum is not very reliable. However, it roughly matches the IRAC photometry and indicates silicate 10 μm, PAH emission and a flat spectral slope in νFν-space, i.e., a composite AGN/star-formation SED (see e.g., [wu_spitzer/irs_2009, gallimore_infrared_2010, dale_spitzer_2009] for detailed versions). We observed the core of NGC 4579 with VISIR in several narrow N and one Q-band filters in 2005, 2009 and 2010. The 2005 measurements were analysed and published in [horst_small_2006, horst_mid-infrared_2009]. In addition, we obtained Michelle imaging data in two N-band filters in 2010. In all cases, a compact MIR nucleus without any extended host emission was detected. The nucleus appears marginally resolved in the Michelle images (FWHM(major axis) ~ 0.57arcsec ~ 47 pc; PA~ 38∘), as well as possibly in the VISIR NEII_1 and PAH2_2 images, but not in any other image. Because the Michelle images were taken in bad ambient conditions, it remains uncertain, whether the nucleus is actually marginally resolved at subarcsecond resolution in the MIR. The nuclear fluxes are on average ~ 29% lower than the Spitzer spectrophotometry. The flux difference is particularly high at short wavelengths. In addition, the PAH 11.3 μm emission seems to be weaker or even absent at subarcsecond resolution, while the silicate 10 μm emission feature is still present and possibly even stronger. These results indicate that part or all of the star formation affecting the Spitzer spectrophotometry is not located in the inner ~ 30 pc of the nucleus.
- [cizdziel_multiaperture_1985] P. J. Cizdziel, E. E. Becklin, and C. G. Wynn-Williams. Multiaperture infrared photometry of the nuclei of spiral galaxies . AJ , 90 pp. 731–735, May 1985.
- [contini_complex_2004] Marcella Contini. The complex structure of low-luminosity active galactic nuclei: NGC 4579 . MNRAS , 354 pp. 675–683, November 2004.
- [dale_infrared_2005] D. A. Dale, G. J. Bendo, C. W. Engelbracht, K. D. Gordon, M. W. Regan, L. Armus, J. M. Cannon, D. Calzetti, B. T. Draine, G. Helou, R. D. Joseph, R. C. Kennicutt, A. Li, E. J. Murphy, H. Roussel, F. Walter, H. M. Hanson, D. J. Hollenbach, T. H. Jarrett, L. J. Kewley, C. A. Lamanna, C. Leitherer, M. J. Meyer, G. H. Rieke, M. J. Rieke, K. Sheth, J. D. T. Smith, and M. D. Thornley. Infrared spectral energy distributions of nearby galaxies . ApJ , 633 pp. 857–870, November 2005.
- [dale_spitzer_2009] D. A. Dale, J. D. T. Smith, E. A. Schlawin, L. Armus, B. A. Buckalew, S. A. Cohen, G. Helou, T. H. Jarrett, L. C. Johnson, J. Moustakas, E. J. Murphy, H. Roussel, K. Sheth, S. Staudaher, C. Bot, D. Calzetti, C. W. Engelbracht, K. D. Gordon, D. J. Hollenbach, R. C. Kennicutt, and S. Malhotra. The spitzer infrared nearby galaxies survey: A high-resolution spectroscopy anthology . ApJ , 693 pp. 1821–1834, March 2009.
- [gallimore_infrared_2010] J. F. Gallimore, A. Yzaguirre, J. Jakoboski, M. J. Stevenosky, D. J. Axon, S. A. Baum, C. L. Buchanan, M. Elitzur, M. Elvis, C. P. O'Dea, and A. Robinson. Infrared spectral energy distributions of seyfert galaxies: Spitzer space telescope observations of the 12 μm sample of active galaxies . ApJS , 187 pp. 172–211, March 2010.
- [ho_search_1997-1] Luis C. Ho, Alexei V. Filippenko, and Wallace L. W. Sargent. A search for ``Dwarf'' seyfert nuclei. III. spectroscopic parameters and properties of the host galaxies . ApJS , 112 pp. 315, October 1997.
- [horst_mid-infrared_2009] H. Horst, W. J. Duschl, P. Gandhi, and A. Smette. Mid-infrared imaging of 25 local AGN with VLT-VISIR . A&A , 495 pp. 137–146, February 2009.
- [horst_small_2006] H. Horst, A. Smette, P. Gandhi, and W. J. Duschl. The small dispersion of the mid IR - hard x-ray correlation in active galactic nuclei . A&A , 457 pp. L17–L20, October 2006.
- [lawrence_observations_1985] A. Lawrence, M. Ward, M. Elvis, G. Fabbiano, S. P. Willner, N. P. Carleton, and A. Longmore. Observations from 1 to 20 microns of low-luminosity active galaxies . ApJ , 291 pp. 117–127, April 1985.
- [munoz-mateos_radial_2009] J. C. Muñoz-Mateos, A. Gil de Paz, J. Zamorano, S. Boissier, D. A. Dale, P. G. Pérez-González, J. Gallego, B. F. Madore, G. Bendo, A. Boselli, V. Buat, D. Calzetti, J. Moustakas, and R. C. Kennicutt. Radial distribution of stars, gas, and dust in SINGS galaxies. i. surface photometry and morphology . ApJ , 703 pp. 1569–1596, October 2009.
- [ramos_almeida_mid-infrared_2007] C. Ramos Almeida, A. M. Pérez García, J. A. Acosta-Pulido, and J. M. Rodríguez Espinosa. The mid-infrared emission of seyfert galaxies: A new analysis of ISOCAM data . AJ , 134 pp. 2006–2019, November 2007.
- [roussel_atlas_2001] H. Roussel, L. Vigroux, A. Bosma, M. Sauvage, C. Bonoli, P. Gallais, T. Hawarden, J. Lequeux, S. Madden, and P. Mazzei. An atlas of mid-infrared dust emission in spiral galaxies . A&A , 369 pp. 473–509, April 2001.
- [scoville_10_1983] N. Z. Scoville, E. E. Becklin, J. S. Young, and R. W. Capps. A 10 micron survey of star formation in galactic nuclei virgo spiral galaxies . ApJ , 271 pp. 512–523, August 1983.
- [smith_spitzer_2007] Beverly J. Smith, Curtis Struck, Mark Hancock, Philip N. Appleton, Vassilis Charmandaris, and William T. Reach. The spitzer spirals, bridges, and tails interacting galaxy survey: Interaction-induced star formation in the mid-infrared . AJ , 133 pp. 791–817, March 2007.
- [tully_nearby_1988] R. Brent Tully. Nearby galaxies catalog . Cambridge University Press, 1988.
- [ulvestad_origin_2001] James S. Ulvestad and Luis C. Ho. The origin of radio emission in low-luminosity active galactic nuclei: Jets, accretion flows, or both? . ApJL , 562 pp. L133–L136, December 2001.
- [wu_spitzer/irs_2009] Yanling Wu, Vassilis Charmandaris, Jiasheng Huang, Luigi Spinoglio, and Silvia Tommasin. Spitzer/IRS 5-35 μm low-resolution spectroscopy of the 12 μm seyfert sample . ApJ , 701 pp. 658–676, August 2009.
Images
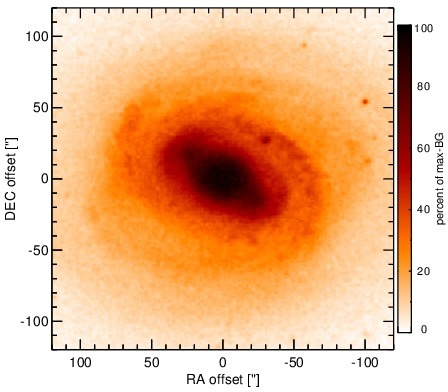
Optical image (DSS, red filter). Displayed are the central 4 arcmin with North being up and East to the left. The colour scaling is linear with white corresponding to the median background (BG) and black to the 0.01% pixels with the highest intensity.
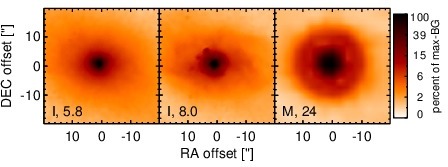
Spitzer MIR images. Displayed are the inner 40 arcsec with North being up and East to the left. The colour scaling is logarithmic with white corresponding to median BG and black to the 0.1% pixels with the highest intensity. The label in the bottom left states instrument and central wavelength of the filter in micron (I: IRAC, M: MIPS).
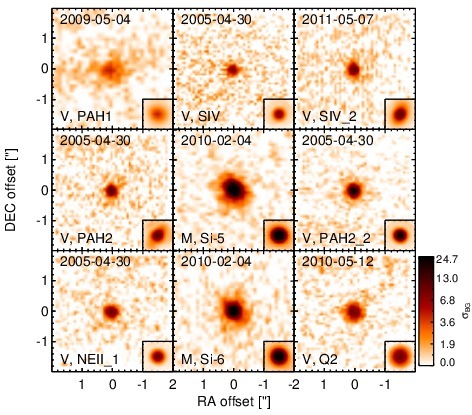
Subarcsecond-resolution MIR images sorted by increasing filter central wavelength. Displayed are the inner 4 arcsec with North being up and East to the left. The colour scaling is logarithmic with white corresponding to median BG and black to the 75% of the highest intensity of all images in units of sig_bg. The inset image (where present; either bottom or top right) shows the central arcsecond of the PSF from the calibrator star, scaled to match the science target. The labels in the bottom left state instrument and filter names (C: COMICS, M: Michelle, T: T-ReCS, V: VISIR).
SEDs
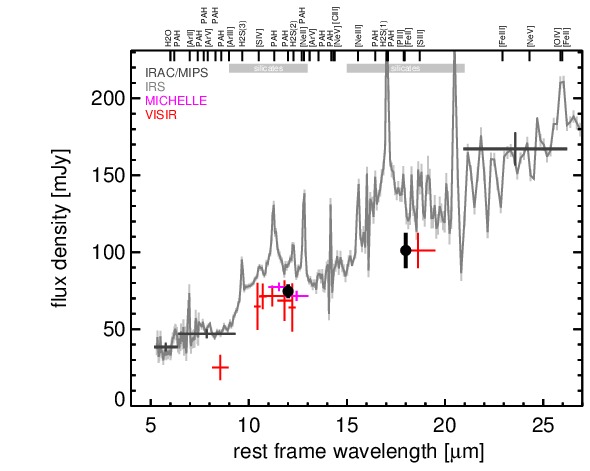
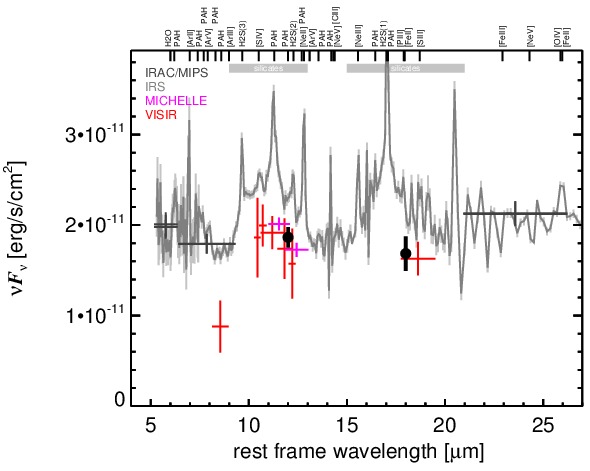
MIR SED. The description of the symbols in all the SED plots (where present) is the following: Grey crosses and solid lines mark the Spitzer/IRAC, MIPS and IRS data. The colour coding of the other symbols is as follows: green for COMICS, magenta for Michelle, blue for T-ReCS and red for VISIR data. Darker-coloured solid lines mark spectra of the corresponding instrument. The black filled circles mark the nuclear 12 and 18 micron continuum emission estimate from the data (where present). The ticks on the top axis mark positions of common MIR emission lines, while the light grey horizontal bars mark wavelength ranges affected by the silicate 10 and 18 micron features.