Sasmirala Individual Information for NGC 4594
Description
NGC 4594 is an edge-on early-type spiral galaxy at a distance of D = 9.1 ± 3.4 Mpc (NED redshift-independent median) with an active nucleus classified as a LINER (previously classified as a Sy 1.9; [veron-cetty_catalogue_2010]), which appears as a compact radio source with a flat spectrum [shaffer_vlbi_1979, thean_high-resolution_2000]. The AGN is also discussed as “true”-Sy 2 candidate [shi_unobscured_2010]. First unsuccessful attempts to observe the nucleus in the MIR were made by [kleinmann_infrared_1970] and [rieke_10_1978]. [maiolino_new_1995] first detected the nucleus with the MMT bolometer, while it remained undetected again in the first subarcsecond-resolution N-band imaging attempts with Palomar 5 m/MIRLIN [gorjian_10_2004] and ESO 3.6 m/TIMMI2 [raban_core_2008]. Finally, the nucleus could be detected with Keck/LWS in N-band in 2003 where it appeared marginally resolved (FWHM~ 0,5arcsec ~ 22 pc; [grossan_high_2004]). In the IRAC and MIPS images the nucleus appears extended and embedded within elliptical host emission. The famous large-scale dust ring is also detected and becomes brighter towards longer wavelengths. We measure the nuclear flux in the IRAC 5.8 and 8.0 μm and MIPS 24 μm images, which results in values consistent with the nuclear fluxes in [bendo_spitzer_2006]. The IRS LR mapping-mode spectrum shows weak silicate and PAH emission and a blue spectral slope in νFν-space, i.e., it seems to be dominated by old stellar host emission with only minor star formation (see also [bendo_spitzer_2006, smith_mid-infrared_2007, wu_spitzer/irs_2009, shi_unobscured_2010, gallimore_infrared_2010, mason_nuclear_2012]). NGC 4594 was observed with VISIR in PAH2_2 in 2006 [reunanen_vlt_2010], in PAH2 and NEII_1 in 2009 [asmus_mid-infrared_2011] and in PAH2_2 again in 2010 (unpublished, to our knowledge). The nucleus remained undetected in all VISIR images. However, it was also observed with T-ReCS in the Si2 filter in four different nights in 2007 where a compact MIR nucleus is always detected [mason_nuclear_2012]. The low S/N prevents us from performing a quantitative extension analysis, but owing to the fact that the nucleus appears extended in all subarcsecond-resolution images in which it was detected, we classify it as possibly extended. Our measured nuclear photometry is consistent with the previously published values and on average ~ 78% lower than the Spitzer spectrophotometry. Therefore, we conclude that stellar emission completely dominates the MIR SED in the central ~ 200 pc.
- [asmus_mid-infrared_2011] D. Asmus, P. Gandhi, A. Smette, S. F. Hönig, and W. J. Duschl. Mid-infrared properties of nearby low-luminosity AGN at high angular resolution . A&A , 536 pp. 36, December 2011.
- [bendo_spitzer_2006] George J. Bendo, Brent A. Buckalew, Daniel A. Dale, Bruce T. Draine, Robert D. Joseph, Robert C. Kennicutt, Kartik Sheth, John-David T. Smith, Fabian Walter, Daniela Calzetti, John M. Cannon, Charles W. Engelbracht, Karl D. Gordon, George Helou, David Hollenbach, Eric J. Murphy, and Hélène Roussel. Spitzer and JCMT observations of the active galactic nucleus in the sombrero galaxy (NGC 4594) . ApJ , 645 pp. 134–147, July 2006.
- [gallimore_infrared_2010] J. F. Gallimore, A. Yzaguirre, J. Jakoboski, M. J. Stevenosky, D. J. Axon, S. A. Baum, C. L. Buchanan, M. Elitzur, M. Elvis, C. P. O'Dea, and A. Robinson. Infrared spectral energy distributions of seyfert galaxies: Spitzer space telescope observations of the 12 μm sample of active galaxies . ApJS , 187 pp. 172–211, March 2010.
- [gorjian_10_2004] V. Gorjian, M. W. Werner, T. H. Jarrett, D. M. Cole, and M. E. Ressler. 10 micron imaging of seyfert galaxies from the 12 micron sample . ApJ , 605 pp. 156–167, April 2004.
- [grossan_high_2004] Bruce Grossan. High resolution mid-infrared observations of low-luminosity AGN with the keck telescope and LWS . astro-ph/0405190 , May 2004.
- [kleinmann_infrared_1970] D. E. Kleinmann and F. J. Low. Infrared observations of galaxies and of the extended nucleus in m82 . ApJL , 161 pp. L203, September 1970.
- [maiolino_new_1995] R. Maiolino, M. Ruiz, G. H. Rieke, and L. D. Keller. New constraints on the unified model of seyfert galaxies . ApJ , 446 pp. 561, June 1995.
- [mason_nuclear_2012] R. E. Mason, E. Lopez-Rodriguez, C. Packham, A. Alonso-Herrero, N. A. Levenson, J. Radomski, C. Ramos Almeida, L. Colina, M. Elitzur, I. Aretxaga, P. F. Roche, and N. Oi. The nuclear infrared emission of low-luminosity active galactic nuclei. AJ , 144 pp. 11, July 2012.
- [raban_core_2008] D. Raban, B. Heijligers, H. Röttgering, K. Meisenheimer, W. Jaffe, H. U. Käufl, and T. Henning. The core flux of the brightest 10 μm galaxies in the southern sky . A&A , 484 pp. 341–345, June 2008.
- [reunanen_vlt_2010] J. Reunanen, M. A. Prieto, and R. Siebenmorgen. VLT diffraction-limited imaging at 11 and 18μm of the nearest active galactic nuclei . MNRAS , 402 pp. 879–894, February 2010.
- [rieke_10_1978] G. H. Rieke and M. J. Lebofsky. 10 micron observations of bright galaxies . ApJL , 220 pp. L37–L41, March 1978.
- [shaffer_vlbi_1979] D. B. Shaffer and A. P. Marscher. VLBI observations of galactic nuclei at 18 centimeters - NGC 1052, NGC 4278, m82, and m104 . ApJL , 233 pp. L105–L108, November 1979.
- [shi_unobscured_2010] Yong Shi, George H. Rieke, Paul Smith, Jane Rigby, Dean Hines, Jennifer Donley, Gary Schmidt, and Aleksandar M. Diamond-Stanic. Unobscured type 2 active galactic nuclei . ApJ , 714 pp. 115–129, May 2010.
- [smith_mid-infrared_2007] J. D. T. Smith, B. T. Draine, D. A. Dale, J. Moustakas, R. C. Kennicutt, G. Helou, L. Armus, H. Roussel, K. Sheth, G. J. Bendo, B. A. Buckalew, D. Calzetti, C. W. Engelbracht, K. D. Gordon, D. J. Hollenbach, A. Li, S. Malhotra, E. J. Murphy, and F. Walter. The mid-infrared spectrum of star-forming galaxies: Global properties of polycyclic aromatic hydrocarbon emission . ApJ , 656 pp. 770–791, February 2007.
- [thean_high-resolution_2000] Andy Thean, Alan Pedlar, Marek J. Kukula, Stefi A. Baum, and Christopher P. O'Dea. High-resolution radio observations of seyfert galaxies in the extended 12-μm sample - i. the observations . MNRAS , 314 pp. 573–588, May 2000.
- [veron-cetty_catalogue_2010] M.-P. Véron-Cetty and P. Véron. A catalogue of quasars and active nuclei: 13th edition . A&A , 518 pp. 10, July 2010.
- [wu_spitzer/irs_2009] Yanling Wu, Vassilis Charmandaris, Jiasheng Huang, Luigi Spinoglio, and Silvia Tommasin. Spitzer/IRS 5-35 μm low-resolution spectroscopy of the 12 μm seyfert sample . ApJ , 701 pp. 658–676, August 2009.
Images
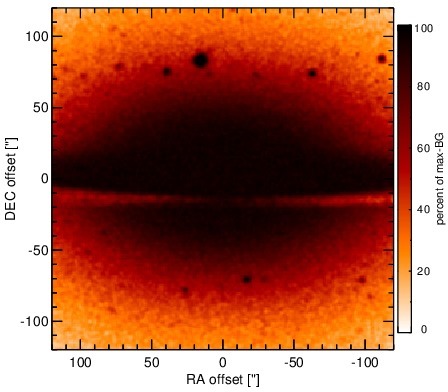
Optical image (DSS, red filter). Displayed are the central 4 arcmin with North being up and East to the left. The colour scaling is linear with white corresponding to the median background (BG) and black to the 0.01% pixels with the highest intensity.
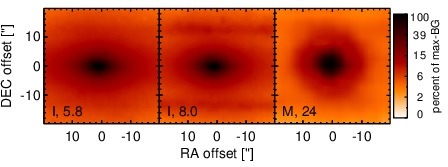
Spitzer MIR images. Displayed are the inner 40 arcsec with North being up and East to the left. The colour scaling is logarithmic with white corresponding to median BG and black to the 0.1% pixels with the highest intensity. The label in the bottom left states instrument and central wavelength of the filter in micron (I: IRAC, M: MIPS).
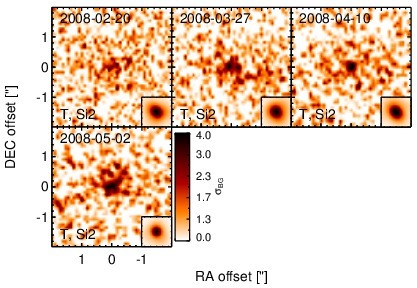
Subarcsecond-resolution MIR images sorted by increasing filter central wavelength. Displayed are the inner 4 arcsec with North being up and East to the left. The colour scaling is logarithmic with white corresponding to median BG and black to the 75% of the highest intensity of all images in units of sig_bg. The inset image (where present; either bottom or top right) shows the central arcsecond of the PSF from the calibrator star, scaled to match the science target. The labels in the bottom left state instrument and filter names (C: COMICS, M: Michelle, T: T-ReCS, V: VISIR).
SEDs
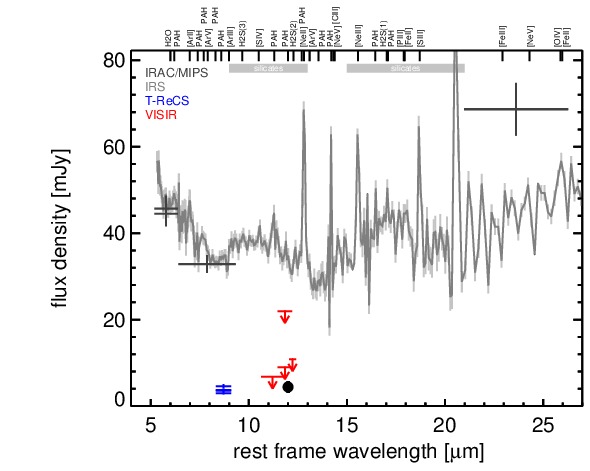
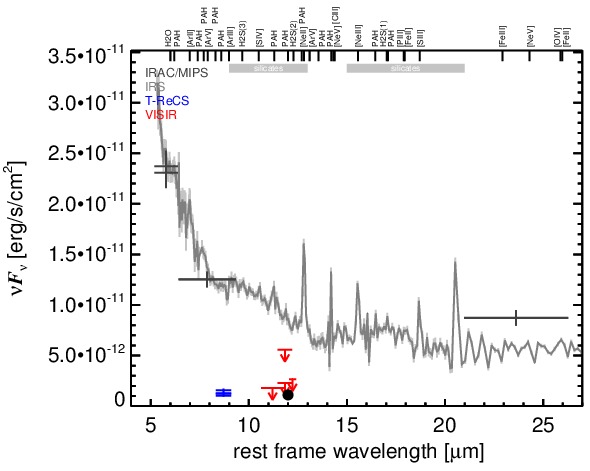
MIR SED. The description of the symbols in all the SED plots (where present) is the following: Grey crosses and solid lines mark the Spitzer/IRAC, MIPS and IRS data. The colour coding of the other symbols is as follows: green for COMICS, magenta for Michelle, blue for T-ReCS and red for VISIR data. Darker-coloured solid lines mark spectra of the corresponding instrument. The black filled circles mark the nuclear 12 and 18 micron continuum emission estimate from the data (where present). The ticks on the top axis mark positions of common MIR emission lines, while the light grey horizontal bars mark wavelength ranges affected by the silicate 10 and 18 micron features.