Sasmirala Individual Information for NGC 4698
Description
NGC 4698 is an inclined early-type spiral galaxy in the Virgo Cluster at a distance of D = 24.4 ± 6.7 Mpc (NED redshift-independent median) that hosts a Sy 2.0 nucleus [veron-cetty_catalogue_2010]. The AGN is considered a “true”-Seyfert 2 candidate ([pappa_x-ray_2001, georgantopoulos_chandra_2003]; but see [shi_unobscured_2010]). However, the hard X-ray point source in its centre might in fact be Compton-thick [gonzalez-martin_fitting_2009]. A compact radio source was weakly detected [ho_radio_2001]. The first ground-based MIR detection attempts remained unsuccessful [scoville_10_1983]. NGC 4698 was observed with the space-based ISO [boselli_mid-ir_1998] and Spitzer/IRAC, IRS and MIPS. The corresponding IRAC and MIPS images show an extended nucleus embedded within large-scale ring-like host emission. Our MIPS 24 μm unresolved nuclear flux measurement agrees with [shi_unobscured_2010]. The IRS LR staring-mode spectrum suffers from low S/N but indicates weak silicate 10 and 18 μm emission, a very weak PAH 11.3μm feature and a blue spectral slope in νFν-space (see also [shi_unobscured_2010]). Therefore, the arcsecond-scale MIR SED does neither indicate intense star formation nor AGN activity. We observed the nuclear region of NGC 4698 with VISIR in the NEII_1 filter in 2006 but did not detect any compact source [horst_mid_2008]. The corresponding flux upper limit is higher than the Spitzer spectrophotometry, which thus is used to derive an upper limit on the 12 μm continuum emission of the AGN in NGC 4698. As discussed already in [asmus_mid-infrared_2011], the nuclear MIR upper limit does not constrain the obscuration in this object.
- [asmus_mid-infrared_2011] D. Asmus, P. Gandhi, A. Smette, S. F. Hönig, and W. J. Duschl. Mid-infrared properties of nearby low-luminosity AGN at high angular resolution . A&A , 536 pp. 36, December 2011.
- [boselli_mid-ir_1998] A. Boselli, J. Lequeux, M. Sauvage, O. Boulade, F. Boulanger, D. Cesarsky, C. Dupraz, S. Madden, F. Viallefond, and L. Vigroux. Mid-IR emission of galaxies in the virgo cluster. II. integrated properties . A&A , 335 pp. 53–68, July 1998.
- [georgantopoulos_chandra_2003] I. Georgantopoulos and A. Zezas. Chandra observations of NGC 4698: A seyfert 2 galaxy with no absorption . ApJ , 594 pp. 704–708, September 2003.
- [gonzalez-martin_fitting_2009] O. González-Martín, J. Masegosa, I. Márquez, and M. Guainazzi. Fitting liner nuclei within the active galactic nucleus family: A matter of obscuration? . ApJ , 704 pp. 1570–1585, October 2009.
- [ho_radio_2001] Luis C. Ho and James S. Ulvestad. Radio continuum survey of an optically selected sample of nearby seyfert galaxies . ApJS , 133 pp. 77–118, March 2001.
- [horst_mid_2008] H. Horst, P. Gandhi, A. Smette, and W. J. Duschl. The mid IR - hard x-ray correlation in AGN and its implications for dusty torus models . A&A , 479 pp. 389–396, February 2008.
- [pappa_x-ray_2001] A. Pappa, I. Georgantopoulos, G. C. Stewart, and A. L. Zezas. The x-ray spectra of optically selected seyfert 2 galaxies: are there any seyfert 2 galaxies with no absorption? . MNRAS , 326 pp. 995–1006, September 2001.
- [scoville_10_1983] N. Z. Scoville, E. E. Becklin, J. S. Young, and R. W. Capps. A 10 micron survey of star formation in galactic nuclei virgo spiral galaxies . ApJ , 271 pp. 512–523, August 1983.
- [shi_unobscured_2010] Yong Shi, George H. Rieke, Paul Smith, Jane Rigby, Dean Hines, Jennifer Donley, Gary Schmidt, and Aleksandar M. Diamond-Stanic. Unobscured type 2 active galactic nuclei . ApJ , 714 pp. 115–129, May 2010.
- [veron-cetty_catalogue_2010] M.-P. Véron-Cetty and P. Véron. A catalogue of quasars and active nuclei: 13th edition . A&A , 518 pp. 10, July 2010.
Images
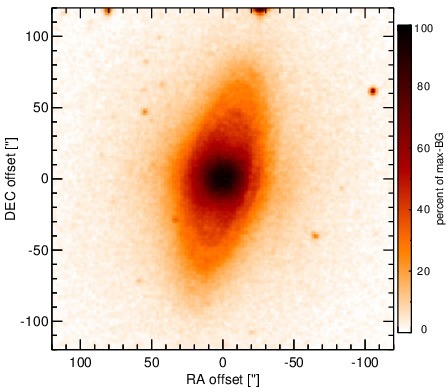
Optical image (DSS, red filter). Displayed are the central 4 arcmin with North being up and East to the left. The colour scaling is linear with white corresponding to the median background (BG) and black to the 0.01% pixels with the highest intensity.
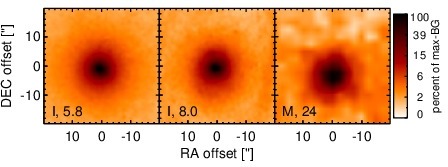
Spitzer MIR images. Displayed are the inner 40 arcsec with North being up and East to the left. The colour scaling is logarithmic with white corresponding to median BG and black to the 0.1% pixels with the highest intensity. The label in the bottom left states instrument and central wavelength of the filter in micron (I: IRAC, M: MIPS).
SEDs
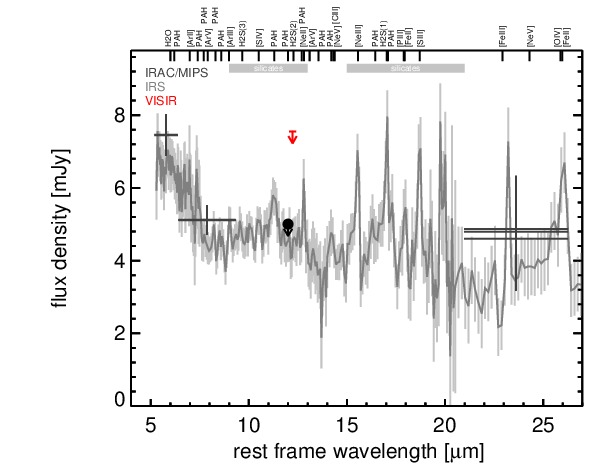
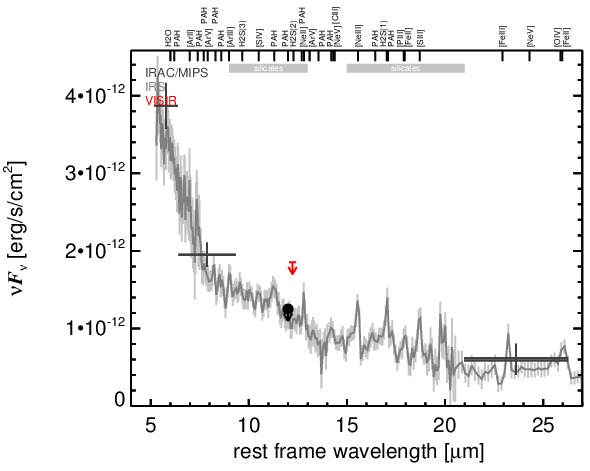
MIR SED. The description of the symbols in all the SED plots (where present) is the following: Grey crosses and solid lines mark the Spitzer/IRAC, MIPS and IRS data. The colour coding of the other symbols is as follows: green for COMICS, magenta for Michelle, blue for T-ReCS and red for VISIR data. Darker-coloured solid lines mark spectra of the corresponding instrument. The black filled circles mark the nuclear 12 and 18 micron continuum emission estimate from the data (where present). The ticks on the top axis mark positions of common MIR emission lines, while the light grey horizontal bars mark wavelength ranges affected by the silicate 10 and 18 micron features.