Sasmirala Individual Information for NGC 4736
Description
NGC 4736 is a spiral galaxy at a distance of D = 4.9 ± 0.8 Mpc (NED redshift-independent median) with an active nucleus classified as a LINER [ho_search_1997-1]. There are indications of a past powerful starburst in the nucleus [walker_2_1988, taniguchi_poststarburst_1996] and a nuclear star cluster [gonzalez_delgado_hst/wfpc2_2008], which could also explain the observed optical emission lines. However, the existence of a compact source in radio, UV and X-ray together with the Hα properties favour the presence of a low-luminosity AGN in NGC 4736 [nagar_radio_2005, kording_radio_2005, gonzalez-martin_x-ray_2009, masegosa_nature_2011]. Therefore, we conclude that an AGN is present in NGC 4736. In fact, it is possible that NGC 4736 harbours a double AGN as suggested by the presence of two UV point sources (separation 2.5arcsec ~ 60 pc, PA~ 170∘; [maoz_detection_1995, maoz_murmur_2005]). The first MIR observations of NGC 4736 are reported by [kleinmann_infrared_1970], [rieke_infrared_1972], [rieke_infrared_1978], and [dyck_photometry_1978]. After IRAS, the galaxy was also observed with ISO/ISOCAM [roussel_atlas_2001] and Spitzer/IRAC, IRS and MIPS. The IRAC and MIPS images show an extended nucleus embedded within bright host emission. Because we measure the nuclear component only, our IRAC 5.8 and 8.0 μm and MIPS 24 μm fluxes are much lower than the literature values (e.g., [dale_infrared_2005, smith_spitzer_2007, munoz-mateos_radial_2009]). The IRS LR mapping-mode PBCD spectrum is not very reliable but matches qualitatively the more accurate versions in the literature [goulding_towards_2009, mason_nuclear_2012]. It exhibits strong PAH emission and weak silicate absorption, indicating star formation in the central ~ 100 pc of NGC 4736. The nuclear region of NGC 4736 was imaged with Michelle in the N- and Q-band in 2007. An extended nucleus (FWHM> 1arcsec) embedded within weak diffuse emission was detected [mason_nuclear_2012]. Our photometry of the unresolved component provides values consistent with [mason_nuclear_2012], while being on average ~ 89% lower than the Spitzer spectrophotometry. Thus, the central ~ 100 pc of NGC 4736 are completely dominated by extended stellar emission. Note that the second possible nucleus has not been detected yet in the MIR.
- [dale_infrared_2005] D. A. Dale, G. J. Bendo, C. W. Engelbracht, K. D. Gordon, M. W. Regan, L. Armus, J. M. Cannon, D. Calzetti, B. T. Draine, G. Helou, R. D. Joseph, R. C. Kennicutt, A. Li, E. J. Murphy, H. Roussel, F. Walter, H. M. Hanson, D. J. Hollenbach, T. H. Jarrett, L. J. Kewley, C. A. Lamanna, C. Leitherer, M. J. Meyer, G. H. Rieke, M. J. Rieke, K. Sheth, J. D. T. Smith, and M. D. Thornley. Infrared spectral energy distributions of nearby galaxies . ApJ , 633 pp. 857–870, November 2005.
- [dyck_photometry_1978] H. M. Dyck, E. E. Becklin, and R. W. Capps. Photometry of spiral galaxy nuclei at 10 μm and 20 μm . In BAAS , volume 10 of BAAS , page 422, March 1978.
- [gonzalez-martin_x-ray_2009] O. González-Martín, J. Masegosa, I. Márquez, M. Guainazzi, and E. Jiménez-Bailón. An x-ray view of 82 LINERs with chandra and XMM-Newton data . A&A , 506 pp. 1107–1121, November 2009.
- [gonzalez_delgado_hst/wfpc2_2008] Rosa M. González Delgado, Enrique Pérez, Roberto Cid Fernandes, and Henrique Schmitt. HST/WFPC2 imaging of the circumnuclear structure of low-luminosity active galactic nuclei. i. data and nuclear morphology . AJ , 135 pp. 747–765, March 2008.
- [goulding_towards_2009] A. D. Goulding and D. M. Alexander. Towards a complete census of AGN in nearby galaxies: a large population of optically unidentified AGN . MNRAS , 398 pp. 1165–1193, September 2009.
- [ho_search_1997-1] Luis C. Ho, Alexei V. Filippenko, and Wallace L. W. Sargent. A search for ``Dwarf'' seyfert nuclei. III. spectroscopic parameters and properties of the host galaxies . ApJS , 112 pp. 315, October 1997.
- [kleinmann_infrared_1970] D. E. Kleinmann and F. J. Low. Infrared observations of galaxies and of the extended nucleus in m82 . ApJL , 161 pp. L203, September 1970.
- [kording_radio_2005] E. Körding, E. Colbert, and H. Falcke. A radio monitoring survey of ultra-luminous x-ray sources . A&A , 436 pp. 427–436, June 2005.
- [maoz_detection_1995] Dan Maoz, Alexei V. Filippenko, Luis C. Ho, Hans-Walter Rix, John N. Bahcall, Donald P. Schneider, and F. Duccio Macchetto. Detection of compact ultraviolet nuclear emission in liner galaxies . ApJ , 440 pp. 91–99, February 1995.
- [maoz_murmur_2005] Dan Maoz, Neil M. Nagar, Heino Falcke, and Andrew S. Wilson. The murmur of the sleeping black hole: Detection of nuclear ultraviolet variability in LINER galaxies . ApJ , 625 pp. 699–715, June 2005.
- [masegosa_nature_2011] J. Masegosa, I. Márquez, A. Ramirez, and O. González-Martín. The nature of nuclear hα emission in LINERs . A&A , 527 pp. 23, March 2011.
- [mason_nuclear_2012] R. E. Mason, E. Lopez-Rodriguez, C. Packham, A. Alonso-Herrero, N. A. Levenson, J. Radomski, C. Ramos Almeida, L. Colina, M. Elitzur, I. Aretxaga, P. F. Roche, and N. Oi. The nuclear infrared emission of low-luminosity active galactic nuclei. AJ , 144 pp. 11, July 2012.
- [munoz-mateos_radial_2009] J. C. Muñoz-Mateos, A. Gil de Paz, J. Zamorano, S. Boissier, D. A. Dale, P. G. Pérez-González, J. Gallego, B. F. Madore, G. Bendo, A. Boselli, V. Buat, D. Calzetti, J. Moustakas, and R. C. Kennicutt. Radial distribution of stars, gas, and dust in SINGS galaxies. i. surface photometry and morphology . ApJ , 703 pp. 1569–1596, October 2009.
- [nagar_radio_2005] N. M. Nagar, H. Falcke, and A. S. Wilson. Radio sources in low-luminosity active galactic nuclei. IV. radio luminosity function, importance of jet power, and radio properties of the complete palomar sample . A&A , 435 pp. 521–543, May 2005.
- [rieke_infrared_1972] G. H. Rieke and F. J. Low. Infrared photometry of extragalactic sources . ApJL , 176 pp. L95, September 1972.
- [rieke_infrared_1978] G. H. Rieke. The infrared emission of seyfert galaxies . ApJ , 226 pp. 550–558, December 1978.
- [roussel_atlas_2001] H. Roussel, L. Vigroux, A. Bosma, M. Sauvage, C. Bonoli, P. Gallais, T. Hawarden, J. Lequeux, S. Madden, and P. Mazzei. An atlas of mid-infrared dust emission in spiral galaxies . A&A , 369 pp. 473–509, April 2001.
- [smith_spitzer_2007] Beverly J. Smith, Curtis Struck, Mark Hancock, Philip N. Appleton, Vassilis Charmandaris, and William T. Reach. The spitzer spirals, bridges, and tails interacting galaxy survey: Interaction-induced star formation in the mid-infrared . AJ , 133 pp. 791–817, March 2007.
- [taniguchi_poststarburst_1996] Yoshiaki Taniguchi, Youichi Ohyama, Toru Yamada, Hideaki Mouri, and Michitoshi Yoshida. The poststarburst galactic nucleus of NGC 4736 . ApJ , 467 pp. 215, August 1996.
- [walker_2_1988] Constance E. Walker, Marcia J. Lebofsky, and George H. Rieke. 2 micron spectroscopy of nearby galaxies and evidence for a late-phase starburst in NGC 4736 . ApJ , 325 pp. 687–693, February 1988.
Images
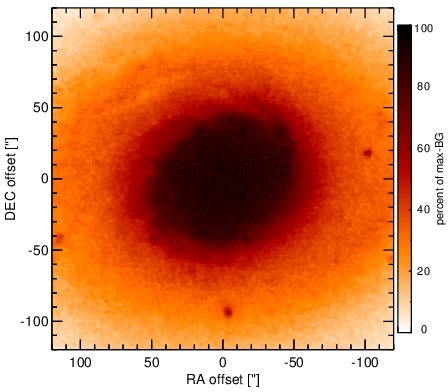
Optical image (DSS, red filter). Displayed are the central 4 arcmin with North being up and East to the left. The colour scaling is linear with white corresponding to the median background (BG) and black to the 0.01% pixels with the highest intensity.
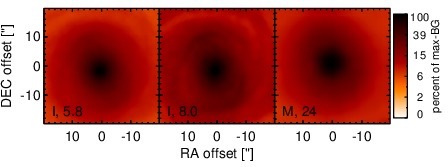
Spitzer MIR images. Displayed are the inner 40 arcsec with North being up and East to the left. The colour scaling is logarithmic with white corresponding to median BG and black to the 0.1% pixels with the highest intensity. The label in the bottom left states instrument and central wavelength of the filter in micron (I: IRAC, M: MIPS).
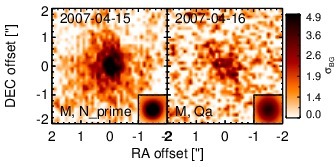
Subarcsecond-resolution MIR images sorted by increasing filter central wavelength. Displayed are the inner 4 arcsec with North being up and East to the left. The colour scaling is logarithmic with white corresponding to median BG and black to the 75% of the highest intensity of all images in units of sig_bg. The inset image (where present; either bottom or top right) shows the central arcsecond of the PSF from the calibrator star, scaled to match the science target. The labels in the bottom left state instrument and filter names (C: COMICS, M: Michelle, T: T-ReCS, V: VISIR).
SEDs
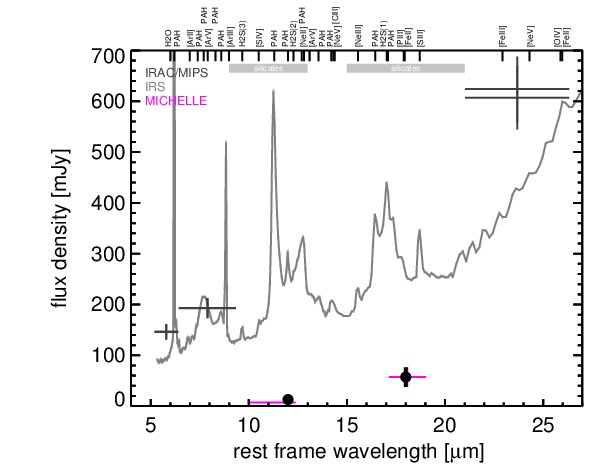
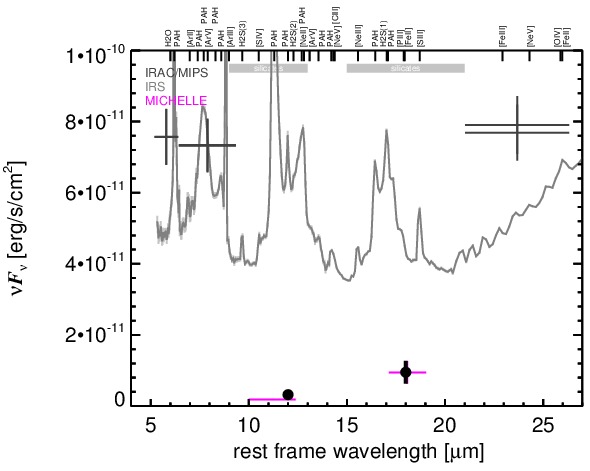
MIR SED. The description of the symbols in all the SED plots (where present) is the following: Grey crosses and solid lines mark the Spitzer/IRAC, MIPS and IRS data. The colour coding of the other symbols is as follows: green for COMICS, magenta for Michelle, blue for T-ReCS and red for VISIR data. Darker-coloured solid lines mark spectra of the corresponding instrument. The black filled circles mark the nuclear 12 and 18 micron continuum emission estimate from the data (where present). The ticks on the top axis mark positions of common MIR emission lines, while the light grey horizontal bars mark wavelength ranges affected by the silicate 10 and 18 micron features.