Sasmirala Individual Information for NGC 5033
Description
NGC 5033 is an inclined spiral galaxy at a distance of D = 18.1 ± 7.4 Mpc (NED redshift-independent median) hosting an AGN, which has optically been classified either as a Sy 1.2, 1.5, 1.8 or 1.9 (see discussion in [trippe_multi-wavelength_2010]). It features a compact radio core with jet-like structure extending ~ 0.5arcsec ~ 45 pc to the east (PA~ 95∘; e.g., [ho_radio_2001]) and a one-sided very wide kiloparsec-scale [O III] cone towards PA~ 80∘ [mediavilla_asymmetrical_2005]. The first MIR observations of NGC 5033 were performed by [rieke_10_1978], but the nucleus remained undetected. [lawrence_observations_1985] report the first detection in N- and Q-band, followed by [devereux_spatial_1987], [edelson_broad-band_1987] and [maiolino_new_1995]. NGC 5033 was also observed with ISO [clavel_2.5-11_2000, ramos_almeida_mid-infrared_2007]. The first subarcsecond-resolution N-band image was obtained with Palomar 5 m/MIRLIN in 2000 [gorjian_10_2004]. The Spitzer/IRAC and MIPS images show an extended nucleus embedded within the spiral-like host emission. Our nuclear IRAC 5.8 and 8.0 μm fluxes are significantly lower than the values given in [gallimore_infrared_2010] but in agreement with the Spitzer/IRS LR mapping PBCD spectrum. The latter exhibits prominent PAH emission and a rather flat spectral slop in νFν-space (see also [dale_spitzer_2009, wu_spitzer/irs_2009, goulding_towards_2009, gallimore_infrared_2010, marble_aromatic_2010]). Thus, the arcsecond-scale MIR SED is dominated by significant star formation. The nuclear region of NGC 5033 was observed with Michelle in the N’ filter in 2008 [mason_nuclear_2012] and in the Si-5 filter in 2010 (this work). A compact nucleus was detected that is embedded within very weak emission extending in north-south direction. This extended emission coincides with the edges of the NLR cone and was detected in both images (diameter~ 2arcsec ~ 180 pc; PA~-5∘). In the sharper N’ image, the nucleus is possibly marginally resolved (FWHM(major axis)~ 0.42arcsec ~ 37 pc; PA~ 87∘). Additional deeper subarcsecond MIR imaging is required to confirm this morphology. Our nuclear photometry is consistent with [mason_nuclear_2012] and on average ~ 87% lower than the Spitzer spectrophotometry. The low spectral coverage does not permit characterisation of the nature of the nuclear MIR emission. We conclude that the MIR emission of the central ~ 350 pc in NGC 5033 is dominated by extended emission from star formation and the NLR.
- [clavel_2.5-11_2000] J. Clavel, B. Schulz, B. Altieri, P. Barr, P. Claes, A. Heras, K. Leech, L. Metcalfe, and A. Salama. 2.5-11 micron spectroscopy and imaging of AGNs. implication for unification schemes . A&A , 357 pp. 839–849, May 2000.
- [dale_spitzer_2009] D. A. Dale, J. D. T. Smith, E. A. Schlawin, L. Armus, B. A. Buckalew, S. A. Cohen, G. Helou, T. H. Jarrett, L. C. Johnson, J. Moustakas, E. J. Murphy, H. Roussel, K. Sheth, S. Staudaher, C. Bot, D. Calzetti, C. W. Engelbracht, K. D. Gordon, D. J. Hollenbach, R. C. Kennicutt, and S. Malhotra. The spitzer infrared nearby galaxies survey: A high-resolution spectroscopy anthology . ApJ , 693 pp. 1821–1834, March 2009.
- [devereux_spatial_1987] Nicholas Devereux. The spatial distribution of 10 micron luminosity in spiral galaxies . ApJ , 323 pp. 91–107, December 1987.
- [edelson_broad-band_1987] R. A. Edelson, M. A. Malkan, and G. H. Rieke. Broad-band properties of the CfA seyfert galaxies. II - infrared to millimeter properties . ApJ , 321 pp. 233–250, October 1987.
- [gallimore_infrared_2010] J. F. Gallimore, A. Yzaguirre, J. Jakoboski, M. J. Stevenosky, D. J. Axon, S. A. Baum, C. L. Buchanan, M. Elitzur, M. Elvis, C. P. O'Dea, and A. Robinson. Infrared spectral energy distributions of seyfert galaxies: Spitzer space telescope observations of the 12 μm sample of active galaxies . ApJS , 187 pp. 172–211, March 2010.
- [gorjian_10_2004] V. Gorjian, M. W. Werner, T. H. Jarrett, D. M. Cole, and M. E. Ressler. 10 micron imaging of seyfert galaxies from the 12 micron sample . ApJ , 605 pp. 156–167, April 2004.
- [goulding_towards_2009] A. D. Goulding and D. M. Alexander. Towards a complete census of AGN in nearby galaxies: a large population of optically unidentified AGN . MNRAS , 398 pp. 1165–1193, September 2009.
- [ho_radio_2001] Luis C. Ho and James S. Ulvestad. Radio continuum survey of an optically selected sample of nearby seyfert galaxies . ApJS , 133 pp. 77–118, March 2001.
- [lawrence_observations_1985] A. Lawrence, M. Ward, M. Elvis, G. Fabbiano, S. P. Willner, N. P. Carleton, and A. Longmore. Observations from 1 to 20 microns of low-luminosity active galaxies . ApJ , 291 pp. 117–127, April 1985.
- [maiolino_new_1995] R. Maiolino, M. Ruiz, G. H. Rieke, and L. D. Keller. New constraints on the unified model of seyfert galaxies . ApJ , 446 pp. 561, June 1995.
- [marble_aromatic_2010] A. R. Marble, C. W. Engelbracht, L. van Zee, D. A. Dale, J. D. T. Smith, K. D. Gordon, Y. Wu, J. C. Lee, R. C. Kennicutt, E. D. Skillman, L. C. Johnson, M. Block, D. Calzetti, S. A. Cohen, H. Lee, and M. D. Schuster. An aromatic inventory of the local volume . ApJ , 715 pp. 506–540, May 2010.
- [mason_nuclear_2012] R. E. Mason, E. Lopez-Rodriguez, C. Packham, A. Alonso-Herrero, N. A. Levenson, J. Radomski, C. Ramos Almeida, L. Colina, M. Elitzur, I. Aretxaga, P. F. Roche, and N. Oi. The nuclear infrared emission of low-luminosity active galactic nuclei. AJ , 144 pp. 11, July 2012.
- [mediavilla_asymmetrical_2005] E. Mediavilla, A. Guijarro, A. Castillo-Morales, J. Jiménez-Vicente, E. Florido, S. Arribas, B. García-Lorenzo, and E. Battaner. Asymmetrical structure of ionization and kinematics in the seyfert galaxy NGC 5033 . A&A , 433 pp. 79–86, April 2005.
- [ramos_almeida_mid-infrared_2007] C. Ramos Almeida, A. M. Pérez García, J. A. Acosta-Pulido, and J. M. Rodríguez Espinosa. The mid-infrared emission of seyfert galaxies: A new analysis of ISOCAM data . AJ , 134 pp. 2006–2019, November 2007.
- [rieke_10_1978] G. H. Rieke and M. J. Lebofsky. 10 micron observations of bright galaxies . ApJL , 220 pp. L37–L41, March 1978.
- [trippe_multi-wavelength_2010] M. L. Trippe, D. M. Crenshaw, R. P. Deo, M. Dietrich, S. B. Kraemer, S. E. Rafter, and T. J. Turner. A multi-wavelength study of the nature of type 1.8/1.9 seyfert galaxies . ApJ , 725 pp. 1749–1767, December 2010.
- [wu_spitzer/irs_2009] Yanling Wu, Vassilis Charmandaris, Jiasheng Huang, Luigi Spinoglio, and Silvia Tommasin. Spitzer/IRS 5-35 μm low-resolution spectroscopy of the 12 μm seyfert sample . ApJ , 701 pp. 658–676, August 2009.
Images
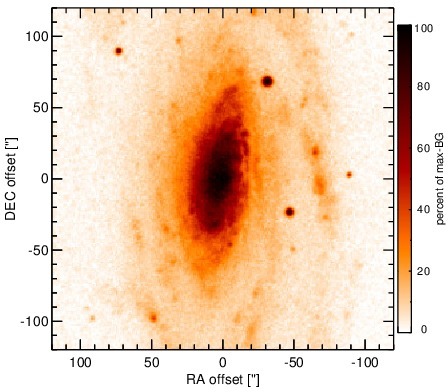
Optical image (DSS, red filter). Displayed are the central 4 arcmin with North being up and East to the left. The colour scaling is linear with white corresponding to the median background (BG) and black to the 0.01% pixels with the highest intensity.
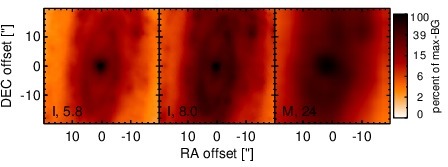
Spitzer MIR images. Displayed are the inner 40 arcsec with North being up and East to the left. The colour scaling is logarithmic with white corresponding to median BG and black to the 0.1% pixels with the highest intensity. The label in the bottom left states instrument and central wavelength of the filter in micron (I: IRAC, M: MIPS).
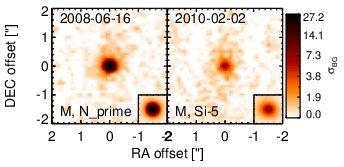
Subarcsecond-resolution MIR images sorted by increasing filter central wavelength. Displayed are the inner 4 arcsec with North being up and East to the left. The colour scaling is logarithmic with white corresponding to median BG and black to the 75% of the highest intensity of all images in units of sig_bg. The inset image (where present; either bottom or top right) shows the central arcsecond of the PSF from the calibrator star, scaled to match the science target. The labels in the bottom left state instrument and filter names (C: COMICS, M: Michelle, T: T-ReCS, V: VISIR).
SEDs
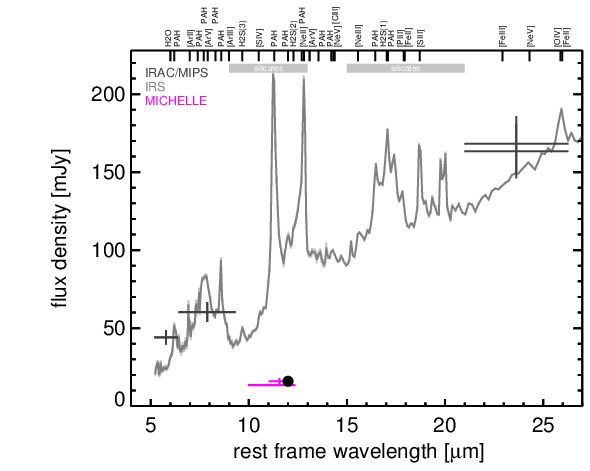
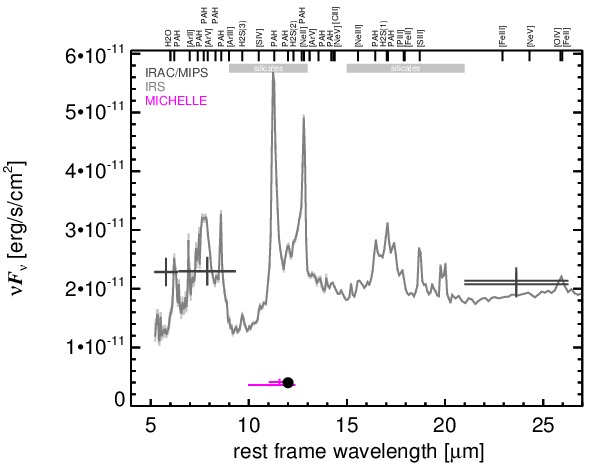
MIR SED. The description of the symbols in all the SED plots (where present) is the following: Grey crosses and solid lines mark the Spitzer/IRAC, MIPS and IRS data. The colour coding of the other symbols is as follows: green for COMICS, magenta for Michelle, blue for T-ReCS and red for VISIR data. Darker-coloured solid lines mark spectra of the corresponding instrument. The black filled circles mark the nuclear 12 and 18 micron continuum emission estimate from the data (where present). The ticks on the top axis mark positions of common MIR emission lines, while the light grey horizontal bars mark wavelength ranges affected by the silicate 10 and 18 micron features.