Sasmirala Individual Information for NGC 5252
Description
NGC 5252 is a lenticular galaxy at a redshift of z = 0.0230 (D ~ 109 Mpc) with an AGN optically classified as either a Sy 1.9 [osterbrock_spectroscopic_1993, trippe_multi-wavelength_2010] or a Sy 2.0 [veron-cetty_catalogue_2010]. It is listed in the nine-month BAT AGN sample. The galaxy features a compact radio core with jet-like extended emission (diameter ~ 4arcsec ~ 2 kpc, PA~ 175∘) [wilson_ionization_1994] and very prominent, kiloparsec-scale, shell-like ionization cones along a PA~ 167∘ [tadhunter_anisotropic_1989]. NGC 5252 was not detected by IRAS, instead the first MIR detection is reported by [maiolino_new_1995], followed by ISO observations by [prieto_infrared_2003]. In addition, Spitzer/IRS and MIPS observations are available, and the corresponding images show a compact nucleus embedded within very faint host emission. The IRS LR staring-mode spectrum exhibits prominent silicate 10 μm and 18 μm emission and a blue spectral slope in νFν-space. Howver, no PAH emission is detected. The arcsecond-scale MIR SED is, therefore, free of star formation and resembles an unobscured AGN SED. We observed NGC 5252 with VISIR in three narrow N-band filters in 2010 and detected a compact MIR nucleus without any further host emission. The nucleus is possibly marginally resolved in the NEII and SIV filter images, but no elongation is detected in the PAH2_2 filter image. Because the SIV image possess the best resolution, we classify the MIR extension of NGC 5252 as uncertain in the MIR at subarcsecond resolution. However, we note that the PAs measured for the elongated SIV and NEII sources would be consistent with the outflow orientation. Our nuclear photometry is systematically high by ~ 18% as compared to the Spitzer spectrophotometry for unknown reasons. However, it confirms the silicate emission in the central ~ 150 pc of NGC 5252. Thus, we use the IRS spectrum to compute the 12 μm continuum emission estimate corrected for the silicate feature.
- [maiolino_new_1995] R. Maiolino, M. Ruiz, G. H. Rieke, and L. D. Keller. New constraints on the unified model of seyfert galaxies . ApJ , 446 pp. 561, June 1995.
- [osterbrock_spectroscopic_1993] Donald E. Osterbrock and Andre Martel. Spectroscopic study of the CfA sample of seyfert galaxies . ApJ , 414 pp. 552–562, September 1993.
- [prieto_infrared_2003] M. Almudena Prieto and J. A. Acosta-Pulido. The infrared spectral energy distribution of the seyfert 2 prototype NGC 5252 . ApJ , 583 pp. 689–694, February 2003.
- [tadhunter_anisotropic_1989] Clive Tadhunter and Zlatan Tsvetanov. Anisotropic ionizing radiation in NGC5252 . Nature , 341 pp. 422–424, October 1989.
- [trippe_multi-wavelength_2010] M. L. Trippe, D. M. Crenshaw, R. P. Deo, M. Dietrich, S. B. Kraemer, S. E. Rafter, and T. J. Turner. A multi-wavelength study of the nature of type 1.8/1.9 seyfert galaxies . ApJ , 725 pp. 1749–1767, December 2010.
- [veron-cetty_catalogue_2010] M.-P. Véron-Cetty and P. Véron. A catalogue of quasars and active nuclei: 13th edition . A&A , 518 pp. 10, July 2010.
- [wilson_ionization_1994] A. S. Wilson and Z. I. Tsvetanov. Ionization cones and radio ejecta in active galaxies . AJ , 107 pp. 1227–1234, April 1994.
Images
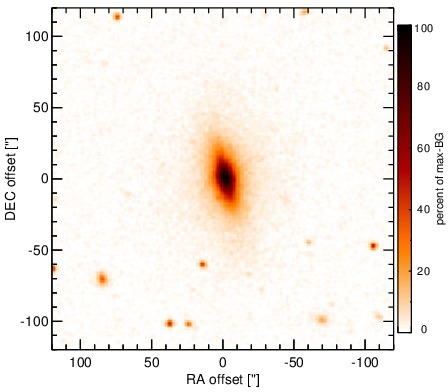
Optical image (DSS, red filter). Displayed are the central 4 arcmin with North being up and East to the left. The colour scaling is linear with white corresponding to the median background (BG) and black to the 0.01% pixels with the highest intensity.
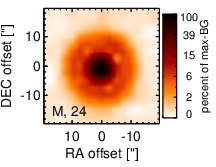
Spitzer MIR images. Displayed are the inner 40 arcsec with North being up and East to the left. The colour scaling is logarithmic with white corresponding to median BG and black to the 0.1% pixels with the highest intensity. The label in the bottom left states instrument and central wavelength of the filter in micron (I: IRAC, M: MIPS).
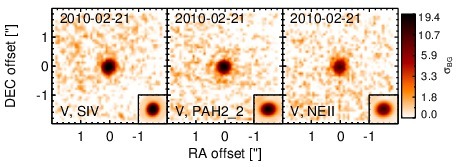
Subarcsecond-resolution MIR images sorted by increasing filter central wavelength. Displayed are the inner 4 arcsec with North being up and East to the left. The colour scaling is logarithmic with white corresponding to median BG and black to the 75% of the highest intensity of all images in units of sig_bg. The inset image (where present; either bottom or top right) shows the central arcsecond of the PSF from the calibrator star, scaled to match the science target. The labels in the bottom left state instrument and filter names (C: COMICS, M: Michelle, T: T-ReCS, V: VISIR).
SEDs
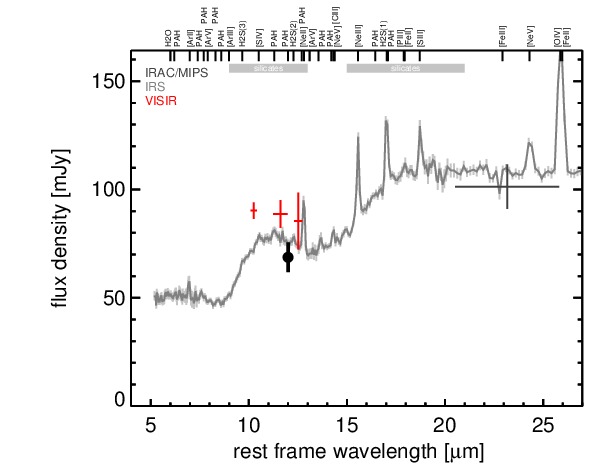
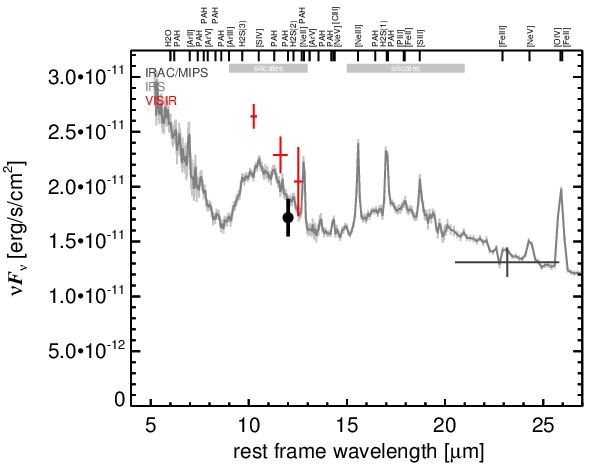
MIR SED. The description of the symbols in all the SED plots (where present) is the following: Grey crosses and solid lines mark the Spitzer/IRAC, MIPS and IRS data. The colour coding of the other symbols is as follows: green for COMICS, magenta for Michelle, blue for T-ReCS and red for VISIR data. Darker-coloured solid lines mark spectra of the corresponding instrument. The black filled circles mark the nuclear 12 and 18 micron continuum emission estimate from the data (where present). The ticks on the top axis mark positions of common MIR emission lines, while the light grey horizontal bars mark wavelength ranges affected by the silicate 10 and 18 micron features.