Sasmirala Individual Information for NGC 5258
Description
NGC 5258 is a disturbed spiral galaxy interacting with NGC 5257 (1.3arcmimin towards the north-west) at a redshift of z = 0.0225 (D ~ 173 Mpc). It possibly harbours an AGN (according to NED) classified as a borderline LINER/H II nucleus (no reference could be retrieved), while [yuan_role_2010] classify it as H II nucleus. No X-ray detection or subarcsecond-resolution radio observation are reported in the literature. After its detection in IRAS, [cutri_statistical_1985], [carico_iras_1988] and [bushouse_distribution_1998] unsuccessfully attempted to detect the nucleus of NGC 5258. The Spitzer/IRAC and MIPS images show extended spiral-like host emission but no nucleus. Instead, the brightest emission region is the inner part of the western spiral arm (closest to NGC 5257; see also [smith_spitzer_2007]). We extract the unresolved part of the emission at the estimated position of the nucleus from the IRAC and MIPS images. However, the MIPS 24 μm measurement is affected by the bright off-nuclear region and, therefore, unreliable. The Spitzer/IRS LR staring-mode spectrum is dominated by PAH emission with a possible weak silicate 10 μm absorption feature and a flat spectral slope in νFν-space (see also [stierwalt_mid-infrared_2013]). Thus, the arcsecond-scale MIR SED is completely star-formation dominated. The nuclear region of NGC 5258 was observed with VISIR in the PAH2 filter in 2005 [siebenmorgen_nuclear_2008] but no nuclear source was detected. Our derived flux upper limit is more conservative than that given in [siebenmorgen_nuclear_2008] but still ~ 67% lower than the Spitzer spectrophotometry. This confirms that the central ~ 2 kpc region of NGC 5258 is completely star-formation dominated.
- [bushouse_distribution_1998] Howard A. Bushouse, C. M. Telesco, and Michael W. Werner. The distribution of mid- and far-infrared emission in 10 interacting galaxy systems . AJ , 115 pp. 938–946, March 1998.
- [carico_iras_1988] David P. Carico, D. B. Sanders, B. T. Soifer, J. H. Elias, K. Matthews, and G. Neugebauer. The IRAS bright galaxy sample. III - 1-10 micron observations and coadded IRAS data for galaxies with l(IR) equal to or greater than 10 to the 11th solar luminosities . AJ , 95 pp. 356–373, February 1988.
- [cutri_statistical_1985] R. M. Cutri and C. W. McAlary. A statistical study of the relationship between galaxy interactions and nuclear activity . ApJ , 296 pp. 90–105, September 1985.
- [siebenmorgen_nuclear_2008] R. Siebenmorgen, M. Haas, E. Pantin, E. Krügel, C. Leipski, H. U. Käufl, P. O. Lagage, A. Moorwood, A. Smette, and M. Sterzik. Nuclear activity in nearby galaxies. mid-infrared imaging with the VLT . A&A , 488 pp. 83–90, September 2008.
- [smith_spitzer_2007] Beverly J. Smith, Curtis Struck, Mark Hancock, Philip N. Appleton, Vassilis Charmandaris, and William T. Reach. The spitzer spirals, bridges, and tails interacting galaxy survey: Interaction-induced star formation in the mid-infrared . AJ , 133 pp. 791–817, March 2007.
- [stierwalt_mid-infrared_2013] S. Stierwalt, L. Armus, J. A. Surace, H. Inami, A. O. Petric, T. Diaz-Santos, S. Haan, V. Charmandaris, J. Howell, D. C. Kim, J. Marshall, J. M. Mazzarella, H. W. W. Spoon, S. Veilleux, A. Evans, D. B. Sanders, P. Appleton, G. Bothun, C. R. Bridge, B. Chan, D. Frayer, K. Iwasawa, L. J. Kewley, S. Lord, B. F. Madore, J. E. Melbourne, E. J. Murphy, J. A. Rich, B. Schulz, E. Sturm, V. U, T. Vavilkin, and K. Xu. Mid-infrared properties of nearby luminous infrared galaxies. i. spitzer infrared spectrograph spectra for the GOALS sample . ApJS , 206 pp. 1, May 2013.
- [yuan_role_2010] T.-T. Yuan, L. J. Kewley, and D. B. Sanders. The role of starburst-active galactic nucleus composites in luminous infrared galaxy mergers: Insights from the new optical classification scheme . ApJ , 709 pp. 884–911, February 2010.
Images
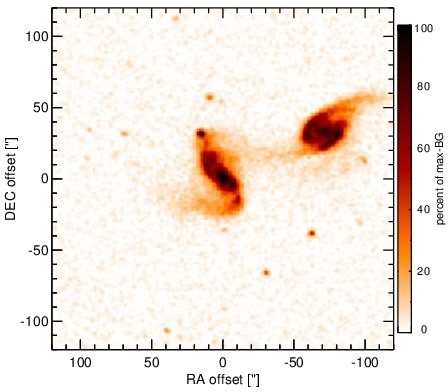
Optical image (DSS, red filter). Displayed are the central 4 arcmin with North being up and East to the left. The colour scaling is linear with white corresponding to the median background (BG) and black to the 0.01% pixels with the highest intensity.
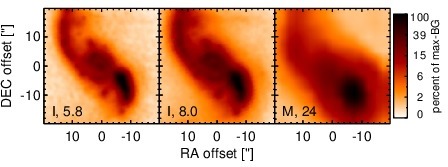
Spitzer MIR images. Displayed are the inner 40 arcsec with North being up and East to the left. The colour scaling is logarithmic with white corresponding to median BG and black to the 0.1% pixels with the highest intensity. The label in the bottom left states instrument and central wavelength of the filter in micron (I: IRAC, M: MIPS).
SEDs
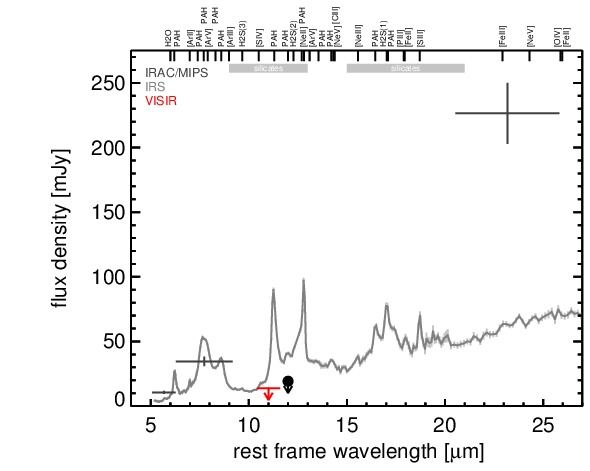
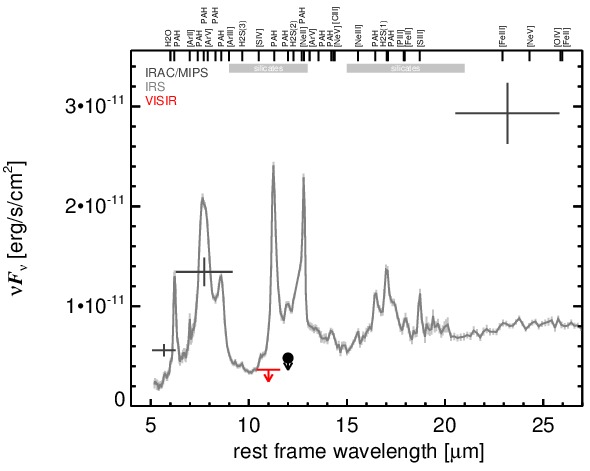
MIR SED. The description of the symbols in all the SED plots (where present) is the following: Grey crosses and solid lines mark the Spitzer/IRAC, MIPS and IRS data. The colour coding of the other symbols is as follows: green for COMICS, magenta for Michelle, blue for T-ReCS and red for VISIR data. Darker-coloured solid lines mark spectra of the corresponding instrument. The black filled circles mark the nuclear 12 and 18 micron continuum emission estimate from the data (where present). The ticks on the top axis mark positions of common MIR emission lines, while the light grey horizontal bars mark wavelength ranges affected by the silicate 10 and 18 micron features.