Sasmirala Individual Information for NGC 5347
Description
NGC 5347 is a low-inclination barred grand-design spiral galaxy at a redshift of z = 0.0078 (D ~ 38.1 Mpc) harbouring a Sy 2 nucleus [veron-cetty_catalogue_2010] with polarized broad emission lines [moran_composite_2001]. It features an unresolved radio core [schmitt_jet_2001], a nuclear water maser [braatz_survey_2003], and a one-sided NLR cone ~ 2arcsec ~ 360 pc to the north (PA~ 30∘; [pogge_circumnuclear_1989, schmitt_hubble_2003]). The first ground-based MIR observations were reported by [maiolino_new_1995], and the first subarcsecond-resolution N-band photometry was published by [gorjian_10_2004] using Palomar 5 m/MIRLIN. In the Spitzer/IRAC and MIPS images, NGC 5347 appears as a bright compact nucleus embedded within very faint host emission. Our nuclear IRAC 5.8 and 8.0 μm photometry is consistent with [gallimore_infrared_2010]. The Spitzer/IRS LR staring-mode spectrum exhibits a very smooth continuum with weak silicate 10 μm absorption, faint PAH features and a wide emission peak around ~ 20 μm in νFν-space (see also [buchanan_spitzer_2006, shi_9.7_2006, wu_spitzer/irs_2009, tommasin_spitzer-irs_2010, gallimore_infrared_2010]). The nuclear region of NGC 5347 was observed with Michelle in the N’ and Qa filters in 2006 (unpublished, to our knowledge), and a compact nucleus without further host emission is detect in both images. A matching standard star observation could be retrieved only for the N’ image, and this standard star shows an elongated PSF that is not visible in the science image. Therefore, we classify the MIR extension of NGC 5347 as uncertain at subarcsecond resolution. The N’ flux is consistent with the Spitzer spectrophotometry, while the Qa flux is significantly higher. This is presumably caused by the use of the median conversion factor in the absence of a matching standard star observation. Therefore, we use the IRS spectrum to compute the nuclear 12 and 18 μm continuum emission estimates.
- [braatz_survey_2003] J. A. Braatz, A. S. Wilson, C. Henkel, R. Gough, and M. Sinclair. A survey for H2O megamasers. III. monitoring water vapor masers in active galaxies . ApJS , 146 pp. 249–265, June 2003.
- [buchanan_spitzer_2006] Catherine L. Buchanan, Jack F. Gallimore, Christopher P. O'Dea, Stefi A. Baum, David J. Axon, Andrew Robinson, Moshe Elitzur, and Martin Elvis. Spitzer IRS spectra of a large sample of seyfert galaxies: A variety of infrared spectral energy distributions in the local active galactic nucleus population . AJ , 132 pp. 401–419, July 2006.
- [gallimore_infrared_2010] J. F. Gallimore, A. Yzaguirre, J. Jakoboski, M. J. Stevenosky, D. J. Axon, S. A. Baum, C. L. Buchanan, M. Elitzur, M. Elvis, C. P. O'Dea, and A. Robinson. Infrared spectral energy distributions of seyfert galaxies: Spitzer space telescope observations of the 12 μm sample of active galaxies . ApJS , 187 pp. 172–211, March 2010.
- [gorjian_10_2004] V. Gorjian, M. W. Werner, T. H. Jarrett, D. M. Cole, and M. E. Ressler. 10 micron imaging of seyfert galaxies from the 12 micron sample . ApJ , 605 pp. 156–167, April 2004.
- [maiolino_new_1995] R. Maiolino, M. Ruiz, G. H. Rieke, and L. D. Keller. New constraints on the unified model of seyfert galaxies . ApJ , 446 pp. 561, June 1995.
- [moran_composite_2001] Edward C. Moran, Laura E. Kay, Marc Davis, Alexei V. Filippenko, and Aaron J. Barth. A composite seyfert 2 x-ray spectrum: Implications for the origin of the cosmic x-ray background . ApJL , 556 pp. L75–L78, August 2001.
- [pogge_circumnuclear_1989] Richard W. Pogge. The circumnuclear environment of nearby, noninteracting seyfert galaxies . ApJ , 345 pp. 730–751, October 1989.
- [schmitt_hubble_2003] H. R. Schmitt, J. L. Donley, R. R. J. Antonucci, J. B. Hutchings, and A. L. Kinney. A hubble space telescope survey of extended [o III] λ5007 emission in a far-infrared selected sample of seyfert galaxies: Observations . ApJS , 148 pp. 327–352, October 2003.
- [schmitt_jet_2001] H. R. Schmitt, J. S. Ulvestad, R. R. J. Antonucci, and A. L. Kinney. Jet directions in seyfert galaxies: Radio continuum imaging data . ApJS , 132 pp. 199–209, February 2001.
- [shi_9.7_2006] Y. Shi, G. H. Rieke, D. C. Hines, V. Gorjian, M. W. Werner, K. Cleary, F. J. Low, P. S. Smith, and J. Bouwman. 9.7 μm silicate features in active galactic nuclei: New insights into unification models . ApJ , 653 pp. 127–136, December 2006.
- [tommasin_spitzer-irs_2010] Silvia Tommasin, Luigi Spinoglio, Matthew A. Malkan, and Giovanni Fazio. Spitzer-IRS high-resolution spectroscopy of the 12 μm seyfert galaxies. II. results for the complete data set . ApJ , 709 pp. 1257–1283, February 2010.
- [veron-cetty_catalogue_2010] M.-P. Véron-Cetty and P. Véron. A catalogue of quasars and active nuclei: 13th edition . A&A , 518 pp. 10, July 2010.
- [wu_spitzer/irs_2009] Yanling Wu, Vassilis Charmandaris, Jiasheng Huang, Luigi Spinoglio, and Silvia Tommasin. Spitzer/IRS 5-35 μm low-resolution spectroscopy of the 12 μm seyfert sample . ApJ , 701 pp. 658–676, August 2009.
Images
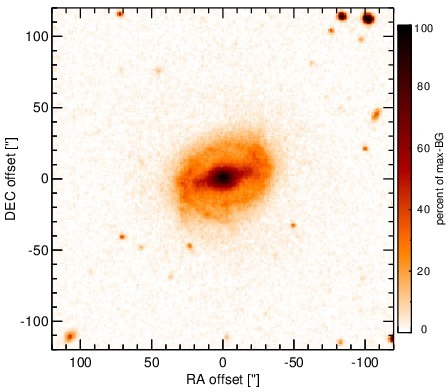
Optical image (DSS, red filter). Displayed are the central 4 arcmin with North being up and East to the left. The colour scaling is linear with white corresponding to the median background (BG) and black to the 0.01% pixels with the highest intensity.
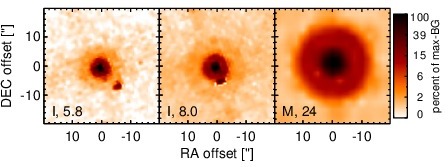
Spitzer MIR images. Displayed are the inner 40 arcsec with North being up and East to the left. The colour scaling is logarithmic with white corresponding to median BG and black to the 0.1% pixels with the highest intensity. The label in the bottom left states instrument and central wavelength of the filter in micron (I: IRAC, M: MIPS).
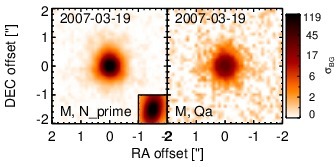
Subarcsecond-resolution MIR images sorted by increasing filter central wavelength. Displayed are the inner 4 arcsec with North being up and East to the left. The colour scaling is logarithmic with white corresponding to median BG and black to the 75% of the highest intensity of all images in units of sig_bg. The inset image (where present; either bottom or top right) shows the central arcsecond of the PSF from the calibrator star, scaled to match the science target. The labels in the bottom left state instrument and filter names (C: COMICS, M: Michelle, T: T-ReCS, V: VISIR).
SEDs
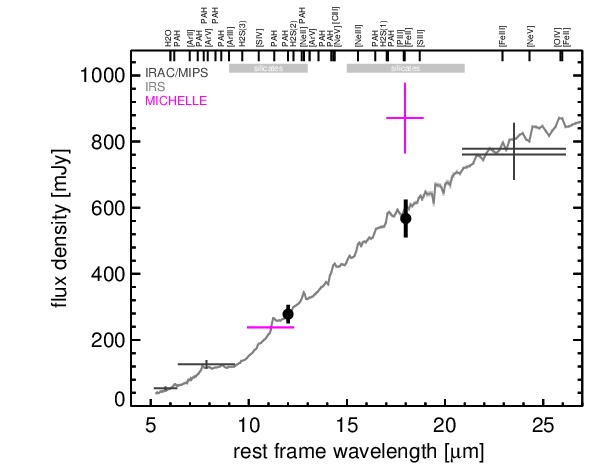
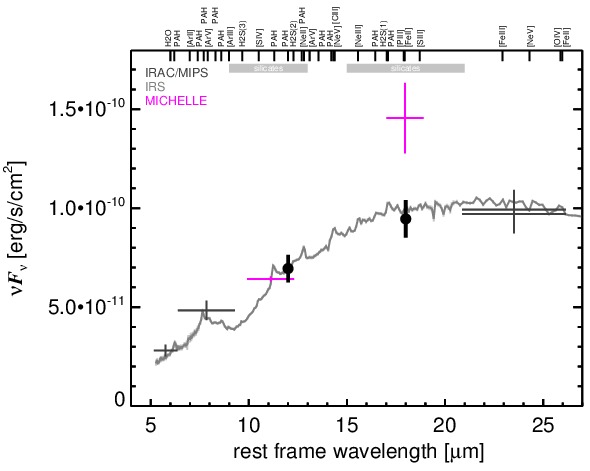
MIR SED. The description of the symbols in all the SED plots (where present) is the following: Grey crosses and solid lines mark the Spitzer/IRAC, MIPS and IRS data. The colour coding of the other symbols is as follows: green for COMICS, magenta for Michelle, blue for T-ReCS and red for VISIR data. Darker-coloured solid lines mark spectra of the corresponding instrument. The black filled circles mark the nuclear 12 and 18 micron continuum emission estimate from the data (where present). The ticks on the top axis mark positions of common MIR emission lines, while the light grey horizontal bars mark wavelength ranges affected by the silicate 10 and 18 micron features.