Sasmirala Individual Information for NGC 5427
Description
NGC 5427 is a face-on grand-design spiral at a distance of D = 29.4 ± 13.5 Mpc [terry_local_2002], which is interacting with NGC 5426 2.3arcmimin to the south. It hosts a Sy 2 nucleus [veron-cetty_catalogue_2010], which appears as a compact radio core [morganti_radio_1999] and is embedded within a compact [O III] emission region, possibly slightly elongated to the north [gonzalez_delgado_h_1997]. The first ground-based MIR observations are reported in [devereux_spatial_1987]. NGC 5427 was also observed with Spitzer/IRAC, IRS and MIPS, and the corresponding images show a compact nucleus embedded within bright spiral-like host emission that blends with the nucleus, in particular in the MIPS 24 μm image (see also [smith_spitzer_2007]). The IRS LR staring-mode spectrum exhibits strong PAH emission, prominent forbidden emission lines and a red spectral slope in νFν-space (see also [pereira-santaella_mid-infrared_2010]). Thus, the arcsecond-scale MIR SED is significantly affected by star formation. The nuclear region of NGC 5427 was observed with VISIR in the PAH2 filter in 2005 [haas_visir_2007] but no source was detected. Our derived flux upper limit is much more conservative than the value given by [haas_visir_2007] but still ~ 74% lower than the Spitzer spectrophotometry. Therefore, the central ~ 0.5 kpc of NGC 5427 are dominated by star-formation in the MIR.
- [devereux_spatial_1987] Nicholas Devereux. The spatial distribution of 10 micron luminosity in spiral galaxies . ApJ , 323 pp. 91–107, December 1987.
- [gonzalez_delgado_h_1997] Rosa M. Gonzalez Delgado, Enrique Perez, Clive Tadhunter, Jose M. Vilchez, and Jose Miguel Rodriguez-Espinosa. H II region population in a sample of nearby galaxies with nuclear activity. i. data and general results . ApJS , 108 pp. 155, January 1997.
- [haas_visir_2007] M. Haas, R. Siebenmorgen, E. Pantin, H. Horst, A. Smette, H.-U. Käufl, P.-O. Lagage, and R. Chini. VISIR / VLT mid-infrared imaging of seyfert nuclei: nuclear dust emission and the seyfert-2 dichotomy . A&A , 473 pp. 369–376, October 2007.
- [morganti_radio_1999] R. Morganti, Z. I. Tsvetanov, J. Gallimore, and M. G. Allen. Radio continuum morphology of southern seyfert galaxies . A&AS , 137 pp. 457–471, June 1999.
- [pereira-santaella_mid-infrared_2010] Miguel Pereira-Santaella, Aleksandar M. Diamond-Stanic, Almudena Alonso-Herrero, and George H. Rieke. The mid-infrared high-ionization lines from active galactic nuclei and star-forming galaxies . ApJ , 725 pp. 2270–2280, December 2010.
- [smith_spitzer_2007] Beverly J. Smith, Curtis Struck, Mark Hancock, Philip N. Appleton, Vassilis Charmandaris, and William T. Reach. The spitzer spirals, bridges, and tails interacting galaxy survey: Interaction-induced star formation in the mid-infrared . AJ , 133 pp. 791–817, March 2007.
- [terry_local_2002] J. N. Terry, G. Paturel, and T. Ekholm. Local velocity field from sosie galaxies. i. the peebles' model . A&A , 393 pp. 57–68, October 2002.
- [veron-cetty_catalogue_2010] M.-P. Véron-Cetty and P. Véron. A catalogue of quasars and active nuclei: 13th edition . A&A , 518 pp. 10, July 2010.
Images
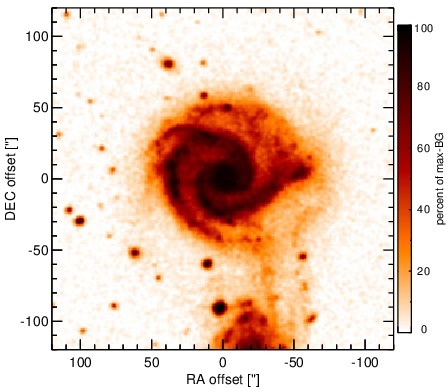
Optical image (DSS, red filter). Displayed are the central 4 arcmin with North being up and East to the left. The colour scaling is linear with white corresponding to the median background (BG) and black to the 0.01% pixels with the highest intensity.
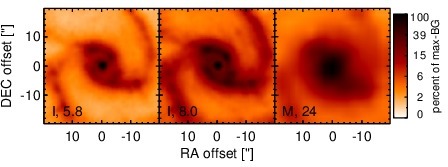
Spitzer MIR images. Displayed are the inner 40 arcsec with North being up and East to the left. The colour scaling is logarithmic with white corresponding to median BG and black to the 0.1% pixels with the highest intensity. The label in the bottom left states instrument and central wavelength of the filter in micron (I: IRAC, M: MIPS).
SEDs
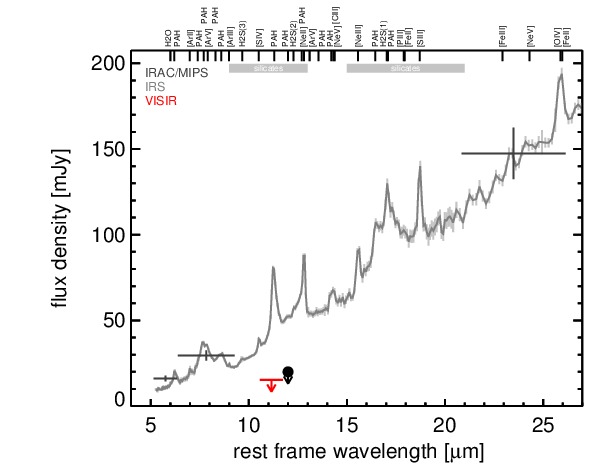
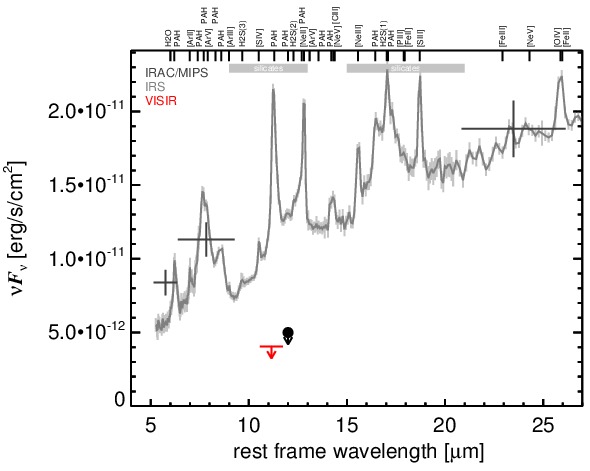
MIR SED. The description of the symbols in all the SED plots (where present) is the following: Grey crosses and solid lines mark the Spitzer/IRAC, MIPS and IRS data. The colour coding of the other symbols is as follows: green for COMICS, magenta for Michelle, blue for T-ReCS and red for VISIR data. Darker-coloured solid lines mark spectra of the corresponding instrument. The black filled circles mark the nuclear 12 and 18 micron continuum emission estimate from the data (where present). The ticks on the top axis mark positions of common MIR emission lines, while the light grey horizontal bars mark wavelength ranges affected by the silicate 10 and 18 micron features.