Sasmirala Individual Information for NGC 5548
Description
NGC 5548 is a face-on spiral galaxy at a redshift of z = 0.0172 (D ~ 80.7 Mpc) with a well-studied Sy 1.5 nucleus [veron-cetty_catalogue_2010]. It is highly variable in optical and X-rays (e.g. [peterson_steps_2002]) and belongs to the nine-month BAT AGN sample. A compact radio-core with biconical structure was detected along a PA~ 160∘ and ~ 15arcsec extent [wilson_radio_1982-1, ho_radio_2001]. The [O III] emission extends to kiloparsec scales in north-south direction, roughly aligned with the radio emission [wilson_kinematics_1989, schmitt_hubble_2003]. The first MIR observation of NGC 5548 were carried out by [kleinmann_infrared_1970], followed by [rieke_infrared_1972, rieke_infrared_1978], and [ward_continuum_1987]. A first subarcsecond-resolution image was obtained with Palomar 5 m/MIRLIN in 2000 [gorjian_10_2004]. NGC 5548 was also observed with ISO [clavel_2.5-11_2000, ramos_almeida_mid-infrared_2007] and Spitzer/IRAC, IRS and MIPS. The corresponding IRAC and MIPS images are dominated by a bright nuclear source, with the extended host emission being faintly visible in the 5.8 and 8.0 μm images. Our nuclear IRAC 5.8 and 8.0 μm photometry is consistent with [gallimore_infrared_2010]. The IRS LR staring-mode spectrum shows silicate 10 and 18 μm emission, a prominent PAH 11.3 μm feature, and an emission peak at ~ 17 μm in νFν-space (see also [buchanan_spitzer_2006, shi_9.7_2006, wu_spitzer/irs_2009, tommasin_spitzer-irs_2010, gallimore_infrared_2010]). Thus, the arcsecond-scale MIR SED appears to be AGN-dominated. The nuclear region of NGC 5548 was observed with VISIR in two narrow N-band filters in 2010 [kishimoto_mapping_2011]. The nucleus appears to be elongated in north-south direction in both images. However, they were taken at a high airmass without matched standard star observations. Therefore, at least another epoch of MIR subarcsecond imaging under good ambient conditions is required to verify this extension, so that we classify the nucleus as possibly extended. Owing to this possible extension, the corresponding nuclear VISIR photometry is very uncertain and ~ 43% lower than the Spitzer spectrophotometry. In addition, all nuclear N-band flux measurements over the last ~ 40 years are consistent with no flux variations within the uncertainties. The only exception is the MIRLIN N flux, which is higher than the long-term average.
- [buchanan_spitzer_2006] Catherine L. Buchanan, Jack F. Gallimore, Christopher P. O'Dea, Stefi A. Baum, David J. Axon, Andrew Robinson, Moshe Elitzur, and Martin Elvis. Spitzer IRS spectra of a large sample of seyfert galaxies: A variety of infrared spectral energy distributions in the local active galactic nucleus population . AJ , 132 pp. 401–419, July 2006.
- [clavel_2.5-11_2000] J. Clavel, B. Schulz, B. Altieri, P. Barr, P. Claes, A. Heras, K. Leech, L. Metcalfe, and A. Salama. 2.5-11 micron spectroscopy and imaging of AGNs. implication for unification schemes . A&A , 357 pp. 839–849, May 2000.
- [gallimore_infrared_2010] J. F. Gallimore, A. Yzaguirre, J. Jakoboski, M. J. Stevenosky, D. J. Axon, S. A. Baum, C. L. Buchanan, M. Elitzur, M. Elvis, C. P. O'Dea, and A. Robinson. Infrared spectral energy distributions of seyfert galaxies: Spitzer space telescope observations of the 12 μm sample of active galaxies . ApJS , 187 pp. 172–211, March 2010.
- [gorjian_10_2004] V. Gorjian, M. W. Werner, T. H. Jarrett, D. M. Cole, and M. E. Ressler. 10 micron imaging of seyfert galaxies from the 12 micron sample . ApJ , 605 pp. 156–167, April 2004.
- [ho_radio_2001] Luis C. Ho and James S. Ulvestad. Radio continuum survey of an optically selected sample of nearby seyfert galaxies . ApJS , 133 pp. 77–118, March 2001.
- [kishimoto_mapping_2011] M. Kishimoto, S. F. Hönig, R. Antonucci, F. Millour, K. R. W. Tristram, and G. Weigelt. Mapping the radial structure of AGN tori . A&A , 536 pp. 78, December 2011.
- [kleinmann_infrared_1970] D. E. Kleinmann and F. J. Low. Infrared observations of galaxies and of the extended nucleus in m82 . ApJL , 161 pp. L203, September 1970.
- [peterson_steps_2002] B. M. Peterson, P. Berlind, R. Bertram, K. Bischoff, N. G. Bochkarev, N. Borisov, A. N. Burenkov, M. Calkins, L. Carrasco, V. H. Chavushyan, R. Chornock, M. Dietrich, V. T. Doroshenko, O. V. Ezhkova, A. V. Filippenko, A. M. Gilbert, J. P. Huchra, W. Kollatschny, D. C. Leonard, W. Li, V. M. Lyuty, Yu. F. Malkov, T. Matheson, N. I. Merkulova, V. P. Mikhailov, M. Modjaz, C. A. Onken, R. W. Pogge, V. I. Pronik, B. Qian, P. Romano, S. G. Sergeev, E. A. Sergeeva, A. I. Shapovalova, O. I. Spiridonova, J. Tao, S. Tokarz, J. R. Valdes, V. V. Vlasiuk, R. M. Wagner, and B. J. Wilkes. Steps toward determination of the size and structure of the broad-line region in active galactic nuclei. XVI. a 13 year study of spectral variability in NGC 5548 . ApJ , 581 pp. 197–204, December 2002.
- [ramos_almeida_mid-infrared_2007] C. Ramos Almeida, A. M. Pérez García, J. A. Acosta-Pulido, and J. M. Rodríguez Espinosa. The mid-infrared emission of seyfert galaxies: A new analysis of ISOCAM data . AJ , 134 pp. 2006–2019, November 2007.
- [rieke_infrared_1972] G. H. Rieke and F. J. Low. Infrared photometry of extragalactic sources . ApJL , 176 pp. L95, September 1972.
- [rieke_infrared_1978] G. H. Rieke. The infrared emission of seyfert galaxies . ApJ , 226 pp. 550–558, December 1978.
- [schmitt_hubble_2003] H. R. Schmitt, J. L. Donley, R. R. J. Antonucci, J. B. Hutchings, and A. L. Kinney. A hubble space telescope survey of extended [o III] λ5007 emission in a far-infrared selected sample of seyfert galaxies: Observations . ApJS , 148 pp. 327–352, October 2003.
- [shi_9.7_2006] Y. Shi, G. H. Rieke, D. C. Hines, V. Gorjian, M. W. Werner, K. Cleary, F. J. Low, P. S. Smith, and J. Bouwman. 9.7 μm silicate features in active galactic nuclei: New insights into unification models . ApJ , 653 pp. 127–136, December 2006.
- [tommasin_spitzer-irs_2010] Silvia Tommasin, Luigi Spinoglio, Matthew A. Malkan, and Giovanni Fazio. Spitzer-IRS high-resolution spectroscopy of the 12 μm seyfert galaxies. II. results for the complete data set . ApJ , 709 pp. 1257–1283, February 2010.
- [veron-cetty_catalogue_2010] M.-P. Véron-Cetty and P. Véron. A catalogue of quasars and active nuclei: 13th edition . A&A , 518 pp. 10, July 2010.
- [ward_continuum_1987] Martin Ward, Martin Elvis, G. Fabbiano, N. P. Carleton, S. P. Willner, and A. Lawrence. The continuum of type 1 seyfert galaxies. i - a single form modified by the effects of dust . ApJ , 315 pp. 74–91, April 1987.
- [wilson_kinematics_1989] A. S. Wilson, Xuening Wu, T. M. Heckman, J. A. Baldwin, and B. Balick. Kinematics and ionization of extended gas in active galaxies. v - the seyfert galaxy NGC 5548 . ApJ , 339 pp. 729–741, April 1989.
- [wilson_radio_1982-1] A. S. Wilson and J. S. Ulvestad. Radio structures of seyfert galaxies. IV - jets in NGC 1068 and NGC 4151 . ApJ , 263 pp. 576–594, December 1982.
- [wu_spitzer/irs_2009] Yanling Wu, Vassilis Charmandaris, Jiasheng Huang, Luigi Spinoglio, and Silvia Tommasin. Spitzer/IRS 5-35 μm low-resolution spectroscopy of the 12 μm seyfert sample . ApJ , 701 pp. 658–676, August 2009.
Images
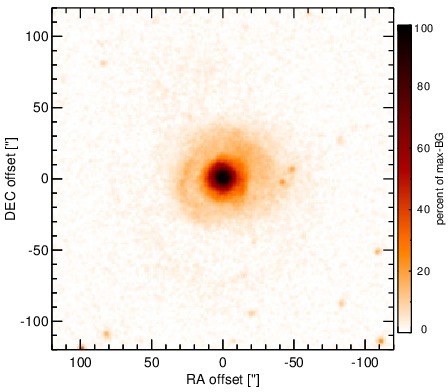
Optical image (DSS, red filter). Displayed are the central 4 arcmin with North being up and East to the left. The colour scaling is linear with white corresponding to the median background (BG) and black to the 0.01% pixels with the highest intensity.
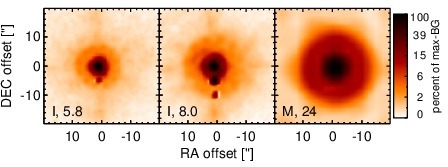
Spitzer MIR images. Displayed are the inner 40 arcsec with North being up and East to the left. The colour scaling is logarithmic with white corresponding to median BG and black to the 0.1% pixels with the highest intensity. The label in the bottom left states instrument and central wavelength of the filter in micron (I: IRAC, M: MIPS).
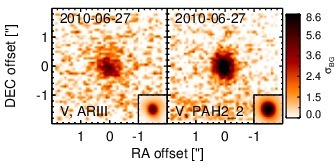
Subarcsecond-resolution MIR images sorted by increasing filter central wavelength. Displayed are the inner 4 arcsec with North being up and East to the left. The colour scaling is logarithmic with white corresponding to median BG and black to the 75% of the highest intensity of all images in units of sig_bg. The inset image (where present; either bottom or top right) shows the central arcsecond of the PSF from the calibrator star, scaled to match the science target. The labels in the bottom left state instrument and filter names (C: COMICS, M: Michelle, T: T-ReCS, V: VISIR).
SEDs
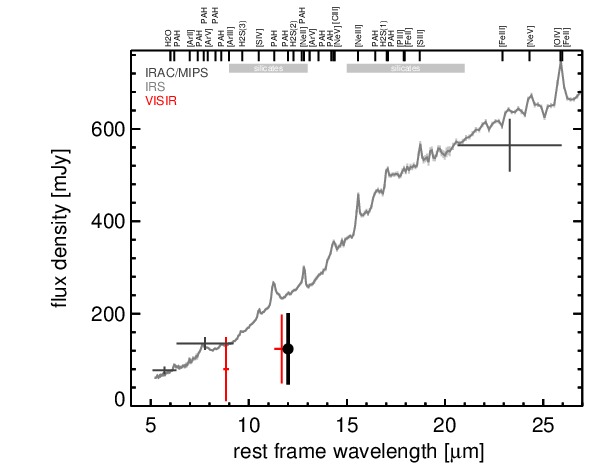
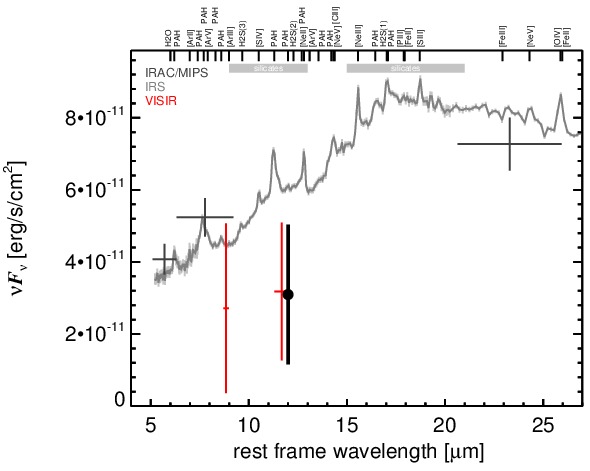
MIR SED. The description of the symbols in all the SED plots (where present) is the following: Grey crosses and solid lines mark the Spitzer/IRAC, MIPS and IRS data. The colour coding of the other symbols is as follows: green for COMICS, magenta for Michelle, blue for T-ReCS and red for VISIR data. Darker-coloured solid lines mark spectra of the corresponding instrument. The black filled circles mark the nuclear 12 and 18 micron continuum emission estimate from the data (where present). The ticks on the top axis mark positions of common MIR emission lines, while the light grey horizontal bars mark wavelength ranges affected by the silicate 10 and 18 micron features.